
MyTT Indicator Library
MyTT (My Mai Language, Tongdaxin, and TongHuaShun (Hithink RoyalFlush)) is an easy-to-use Python library that ports indicator formulas from Tongdaxin, Hithink RoyalFlush, Wenhua My Language, and similar platforms to Python in a simplified form. Common indicators implemented by the library include MACD, RSI, BOLL, ATR, KDJ, CCI, and PSY. MyTT is built upon NumPy and pandas.
To help users calculate these technical indicators in DolphinDB, we implemented the indicator functions included in MyTT using DolphinDB scripts and packaged them into the DolphinDB mytt module. Compared with the MyTT library in Python, the calculation functions in the DolphinDB mytt module offer significantly better batch-processing performance and support DolphinDB's streaming incremental calculation, enabling direct use in real-time stream processing scenarios.
1. Naming and Usage Conventions
-
In the Python MyTT library, all function names and parameter names are in uppercase. In the DolphinDB mytt module, the function names, parameter names, and default parameter values are kept identical to those in Python MyTT, making it easier to use.
-
For meaningful calculation results, all mytt function parameters that represent a time span must be at least 2.
-
Because the
LASTfunction conflicts with a built-in keyword in DolphinDB, this function is namedLAST_in mytt.
2. Environment Configuration
The mytt module is pre-installed with DolphinDB Server. It is located in the [home]/modules directory, which can be verified using the getHomeDir() function.
3. Usage Examples
3.1 Direct Use of Indicator Functions in Scripts
Use the EMA function (exponential moving average) in the mytt module on a vector:
//If mytt is not specified in the preloadModules configuration, the module must be loaded manually once in each new session.
use mytt

close = 7.2 6.97 7.08 6.74 6.49 5.9 6.26 5.9 5.35 5.63
x = EMA(close, 5)
3.2 Grouped Calculations in SQL Statements
It is often necessary to perform calculations separately for each group in a data table. The following example first creates a table that contains two stocks:
use mytt

close = 7.2 6.97 7.08 6.74 6.49 5.9 6.26 5.9 5.35 5.63 3.81 3.935 4.04 3.74 3.7 3.33 3.64 3.31 2.69 2.72
date = (2020.03.02 + 0..4 join 7..11).take(20)
symbol = take(`F,10) join take(`GPRO,10)
t = table(symbol, date, close)
Use the EMA function in the mytt module to calculate values for each stock:
update t set EMA = EMA(close, 5) context by symbol3.3 Results with Multiple Columns
Some functions return results with multiple columns, such as the BIAS function (bias ratio indicator).
Example:
use mytt

close = 7.2 6.97 7.08 6.74 6.49 5.9 6.26 5.9 5.35 5.63
bias1, bias2, bias3 = BIAS(close, L1 = 2, L2 = 4, L3 = 6)
Example of use in an SQL statement:
use mytt

close = 7.2 6.97 7.08 6.74 6.49 5.9 6.26 5.9 5.35 5.63 3.81 3.935 4.04 3.74 3.7 3.33 3.64 3.31 2.69 2.72
date = (2020.03.02 + 0..4 join 7..11).take(20)
symbol = take(`F,10) join take(`GPRO,10)
t = table(symbol, date, close)
select *, BIAS(close, L1 = 2, L2 = 4, L3 = 6) as `bias1`bias2`bias3 from t context by symbol

/* output:
symbol date close bias1 bias2 bias3
------ ---------- ----- -------- -------- --------
F 2020.03.02 7.2
F 2020.03.03 6.97 -1.623
F 2020.03.04 7.08 0.783
F 2020.03.05 6.74 -2.46 -3.68
F 2020.03.06 6.49 -1.89 -4.839
F 2020.03.09 5.9 -4.762 -9.958 -12.333
F 2020.03.10 6.26 2.961 -1.378 -4.767
F 2020.03.11 5.9 -2.961 -3.87 -7.74
F 2020.03.12 5.35 -4.889 -8.586 -12.391
F 2020.03.13 5.63 2.55 -2.679 -4.925
GPRO 2020.03.02 3.81
GPRO 2020.03.03 3.935 1.614
GPRO 2020.03.04 4.04 1.317
GPRO 2020.03.05 3.74 -3.856 -3.639
GPRO 2020.03.06 3.7 -0.538 -3.99
GPRO 2020.03.09 3.33 -5.263 -10.061 -11.417
GPRO 2020.03.10 3.64 4.448 1.041 -2.435
GPRO 2020.03.11 3.31 -4.748 -5.293 -8.732
GPRO 2020.03.12 2.69 -10.333 -17.039 -20.921
GPRO 2020.03.13 2.72 0.555 -11.974 -15.833
*/
4. Performance Comparison
This section compares the performance of direct function calls and grouped calculations. The AVEDEV function is used as an example to evaluate direct-call performance, while real-world daily stock data is used to evaluate grouped-calculation performance across all functions.
4.1 Performance Comparison of Direct Function Calls
In DolphinDB:
use mytt

close = 7.2 6.97 7.08 6.74 6.49 5.9 6.26 5.9 5.35 5.63
close = take(close, 100000)
timer x = mytt::AVEDEV(close, 100)
Using the AVEDEV function in the mytt module directly on a vector of length 100,000 takes 25 ms.
The corresponding Python code is as follows:
import numpy as np
from MyTT import *
import time

close = np.array([7.2,6.97,7.08,6.74,6.49,5.9,6.26,5.9,5.35,5.63])
close = np.tile(close,10000)
start_time = time.time()
x = AVEDEV(close, 100)
print("---%s seconds---" % (time.time() - start_time))
The AVEDEV function in the Python MyTT library takes 25,000 ms, which is 1,000 times longer than the AVEDEV function in the DolphinDB mytt module. The larger the test dataset, the more significant the performance difference. This performance gap stems from DolphinDB's highly optimized C++ implementation and vectorized execution engine, which avoids the overhead of Python's iterative processing.
4.2 Performance Comparison of Grouped Calculations
-
The test data is daily trading data for 2,919 securities on the Shanghai Stock Exchange in 2020, filtered to include only securities with more than 120 trading days. The dataset contains 686,104 records in total.
-
The calculations are performed separately for each stock based on its stock code.
-
For a fair comparison, both the DolphinDB and Python test code were run in a single thread.
The test results are shown in the following table:
| No. | Function | Python (ms) | DolphinDB (ms) | Runtime ratio |
|---|---|---|---|---|
| 1 | RD | 296 | 16 | 18 |
| 2 | RET | 243 | 13 | 18 |
| 3 | ABS | 229 | 15 | 15 |
| 4 | LN | 253 | 25 | 10 |
| 5 | POW | 311 | 30 | 10 |
| 6 | SQRT | 248 | 19 | 13 |
| 7 | MAX | 390 | 34 | 11 |
| 8 | MIN | 373 | 29 | 12 |
| 9 | IF | 282 | 21 | 13 |
| 10 | REF | 740 | 17 | 43 |
| 11 | DIFF | 662 | 22 | 30 |
| 12 | STD | 1,263 | 24 | 98 |
| 13 | SUM | 1,297 | 22 | 58 |
| 14 | CONST | 258 | 22 | 11 |
| 15 | HHV | 1,207 | 30 | 40 |
| 16 | LLV | 1,218 | 31 | 39 |
| 17 | HHVBARS | 2,952 | 41 | 72 |
| 18 | LLVBARS | 2,878 | 38 | 75 |
| 19 | MA | 1,220 | 24 | 50 |
| 20 | EMA | 1,171 | 26 | 45 |
| 21 | SMA | 1,199 | 28 | 42 |
| 22 | WMA | 4,322 | 20 | 216 |
| 23 | DMA | 1,123 | 27 | 41 |
| 24 | AVEDEV | 176,652 | 32 | 5,520 |
| 25 | SLOPE | 53,703 | 29 | 1,851 |
| 26 | FORCAST | 60,321 | 38 | 1,587 |
| 27 | LAST | 4,132 | 38 | 108 |
| 28 | COUNT | 1,249 | 20 | 62 |
| 29 | EVERY | 1,267 | 28 | 45 |
| 30 | EXIST | 1,490 | 22 | 67 |
| 31 | BARSLAST | 559 | 18 | 31 |
| 32 | BARSLASTCOUNT | 607 | 17 | 35 |
| 33 | CROSS_ | 2,088 | 80 | 26 |
| 34 | LONGCROSS | 6,019 | 94 | 64 |
| 35 | VALUEWHEN | 968 | 27 | 35 |
| 36 | BETWEEN | 489 | 42 | 11 |
| 37 | TOPRANGE | 3,647 | 37 | 99 |
| 38 | LOWRANGE | 3,703 | 36 | 103 |
| 39 | MACD | 3,060 | 86 | 35 |
| 40 | KDJ | 4,705 | 144 | 32 |
| 41 | RSI | 2,539 | 103 | 24 |
| 42 | WR | 5,632 | 166 | 33 |
| 43 | BIAS | 5,318 | 135 | 39 |
| 44 | BOLL | 3,067 | 90 | 34 |
| 45 | PSY | 2,596 | 82 | 31 |
| 46 | CCI | 163,681 | 76 | 2,153 |
| 47 | ATR | 2,281 | 101 | 22 |
| 48 | BBI | 3,667 | 66 | 55 |
| 49 | DMI | 6,181 | 250 | 24 |
| 50 | TAQ | 2,292 | 64 | 35 |
| 51 | KTN | 3,170 | 164 | 19 |
| 52 | TRIX | 4,329 | 97 | 44 |
| 53 | VR | 2,732 | 117 | 23 |
| 54 | EMV | 4,437 | 132 | 33 |
| 55 | DPO | 2,455 | 59 | 41 |
| 56 | BRAR | 4,909 | 156 | 31 |
| 57 | DFMA | 2,890 | 52 | 55 |
| 58 | MTM | 1,659 | 43 | 38 |
| 59 | MASS | 4,602 | 99 | 46 |
| 60 | ROC | 2,000 | 63 | 31 |
| 61 | EXPMA | 1,900 | 49 | 38 |
| 62 | OBV | 1,790 | 94 | 19 |
| 63 | MFI | 3,488 | 158 | 22 |
| 64 | ASI | 4,173 | 316 | 13 |
The test results show that the functions in the DolphinDB mytt module significantly outperform those in the Python MyTT library, with speedups reaching up to 5,520× and typical around 30×.
Core Python pandas Test Code
data.groupby("symbol").apply(lambda x: RSI(np.array(x.close), N = 24))Core DolphinDB Test Code
RSI = select symbol, tradedate, mytt::RSI(close, N=24) as `RSI from data context by symbol5. Correctness Verification
Using the test data and code from the grouped-calculation performance comparison, the calculation results of the functions in the DolphinDB mytt module are verified against those of the Python MyTT library.
5.1 Floating-Point Precision Differences
Functions with different calculation results
-
CROSS_, LONGCROSS
Cause
-
Floating-point precision issues
-
The
CROSS_andLONGCROSSfunctions involve comparisons of floating-point values. Before performing the comparison, the DolphinDB mytt module applies rounding to retain 6 decimal places, whereas the Python MyTT library does not perform similar rounding. Therefore, for values that are theoretically equal but differ slightly due to floating-point representation, the two implementations may produce different comparison results, as shown below:

5.2 NULL Value Handling
Functions with different calculation results
-
SUM, DMI, EMV, MASS, MFI, ASI
Cause:
-
If the input vector starts with null values, calculation begins from the first non-null value. The DolphinDB mytt module follows the same calculation rules as the Python MyTT library.
-
For a function with a rolling or cumulative window length of k, the first k - 1 results in each group are NULL. The DolphinDB mytt module follows the same calculation rules as the Python MyTT library.
-
For a function with a rolling or cumulative window length of k, if null values occur after the first non-null value in a group, the Python MyTT library returns NaN for any window that contains Nan. The DolphinDB mytt module calculates the non-null elements in the window according to the calculation rules and returns a non-null result. DolphinDB's approach ensures continuous calculation in real-time streams even when data gaps occur.
DolphinDB code and result:
close = [99.9, NULL, 84.69, 31.38, 60.9, 83.3, 97.26, 98.67]
mytt::SUM(close, 5);

[,,,,276.87, 260.27, 357.53, 371.51]
Python code and result:
close = np.array([99.9, np.nan, 84.69, 31.38, 60.9, 83.3, 97.26, 98.67])
MyTT.SUM(close,5)

array([nan, nan, nan, nan, nan,  nan, 357.53, 371.51])
Taking a sliding window sum as an example, the second element of the close vector is NULL. When calculating the fifth element (60.9), the DolphinDB mytt module looks back over the preceding five-element window, [99.9, NULL, 84.69, 31.38, 60.9], and sums the non-null elements. Therefore, the fifth element of the result vector is 276.87.
The Python MyTT library returns NaN for any window that contains NaN, so the first six elements of the resulting vector are all NaN.
Except for the differences caused by floating-point precision and null value handling described above, the percentage error of the calculation results for all other functions is less than 1e-10.
5.3 Differences in TOPRANGE and LOWRANGE Results
The TOPRANGE function returns, for each element, how many periods the current value has been the highest within a recent window in a sequence S. For example, TOPRANGE(High) indicates the number of days since the most recent high.
The TOPRANGE function in the mytt module differs from the TOPRANGE function in MyTT when calculating the initial data. As shown in the following figure, for the High sequence 16.95, 17.31, 17.34, the corresponding TOPRANGE results are 0, 1, and 2, indicating that each value represents a new high over the preceding 0, 1, and 2 days, respectively. MyTT starts counting only after the data has first declined and then risen, whereas the mytt module starts counting from the beginning of the data. As a result, the calculation results may differ near the beginning of the sequence.
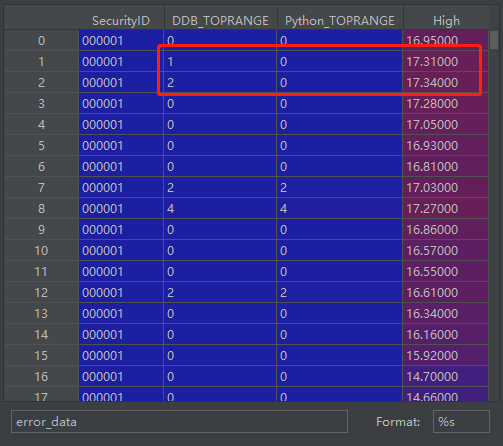
The LOWRANGE function behaves similarly.
6. Real-Time Stream Computing
The reactive state engine (createReactiveStateEngine) is an important component for unified stream and batch computing in many financial scenarios. The DolphinDB mytt module was adapted for this engine during development, enabling most functions in the mytt module to perform incremental calculations in the reactive state engine.
-
Functions that do not require support for use within the Reactive State Engine:
RET, CONST. -
All technical indicator functions in mytt support incremental calculation.
The sample code is as follows:
def cleanEnvironment(){
	try{ unsubscribeTable(tableName="snapshotStream",actionName="aggr1min") } catch(ex){ print(ex) }
	try{ dropStreamEngine("myttReactiveStateEngine") } catch(ex){ print(ex) }
	try{ dropStreamEngine("aggr1min") } catch(ex){ print(ex) }
	try{ dropStreamTable(`snapshotStream) } catch(ex){ print(ex) }
	try{ dropStreamTable(`outputTable) } catch(ex){ print(ex) }
	undef all
}
cleanEnvironment()
go

//load modules
use mytt

//define stream table
name = `tradetime`SecurityID`high`low`open`close`vol
type = `TIMESTAMP`SYMBOL`DOUBLE`DOUBLE`DOUBLE`DOUBLE`INT
share streamTable(100:0, name, type) as snapshotStream
name = `SecurityID`tradetime`K`D`J`DIF`DEA`MACD`UPPER`MID`LOWER`ROC`MAROC
type = `SYMBOL`TIMESTAMP`DOUBLE`DOUBLE`DOUBLE`DOUBLE`DOUBLE`DOUBLE`DOUBLE`DOUBLE`DOUBLE`DOUBLE`DOUBLE
share streamTable(1000000:0, name, type) as outputTable

//register streaming engine
reactiveStateMetrics=<[
    tradetime,
    mytt::KDJ(close, high, low, N=9, M1=3, M2=3) as `K`D`J,
    mytt::MACD(close, SHORT_=12, LONG_=26, M=9) as `DIF`DEA`MACD,
    mytt::KTN(close, high, low, N=20, M=10) as `UPPER`MID`LOWER,
    mytt::ROC(close, N=12, M=6) as `ROC`MAROC
]>

createReactiveStateEngine("myttReactiveStateEngine", metrics=reactiveStateMetrics, dummyTable=snapshotStream, outputTable=outputTable, keyColumn=`SecurityID, keepOrder=true)

createTimeSeriesEngine(name="aggr1min", windowSize=60000, step=60000, metrics=<[first(open),max(high),min(low),last(close),sum(vol)]>, dummyTable=snapshotStream, outputTable=getStreamEngine("myttReactiveStateEngine"), timeColumn=`tradetime, useWindowStartTime=true, keyColumn=`SecurityID)

subscribeTable(tableName="snapshotStream", actionName="aggr1min", offset=-1, handler=getStreamEngine("aggr1min"), msgAsTable=true, batchSize=2000, throttle=1, hash=0, reconnect=true)
7. DolphinDB mytt Indicators
7.1 Core Utility Functions
| Function | Syntax | Description |
|---|---|---|
| RD | RN(N,D=3) | Round to three decimal places |
| RET | RET(S,N=1) | Return the Nth-to-last value in a sequence. By default, return the last value |
| ABS | ABS(S) | Return the absolute value of sequence or scalar S |
| LN | LN(S) | Calculate the natural logarithm (base e) of the values in sequence S |
| POW | POW(S,N) | Raise the values in sequence S to the Nth power |
| SQRT | SQRT(S) | Calculate the square root of the values in sequence S |
| MAX | MAX(S1,S2) | Compare two sequences element by element and return the larger value for each pair |
| MIN | MIN(S1,S2) | Compare two sequences element by element and return the smaller value for each pair |
| IF | IF(S,A,B) | Perform a Boolean check on a sequence: if S==True return A else B |
| REF | REF(S,N=1) | Shift the entire sequence backward by N positions and returns the shifted sequence, introducing NaN values. |
| DIFF | DIFF(S,N=1) | Calculate the difference between the previous and current values of sequence S; the beginning of the sequence is filled with NaN. |
| STD | STD(S,N) | Calculate the rolling standard deviation of sequence S over N periods and return the resulting rolling standard deviation sequence |
| SUM | SUM(S,N) | Calculate the rolling N-day sum of sequence S |
| CONST | CONST(S) | Return a constant sequence consisting of the last value of sequence S |
| HHV | HHV(S,N) | Calculate the rolling maximum of sequence S over N periods and return the resulting rolling maximum sequence |
| LLV | LLV(S,N) | Calculate the rolling minimum of sequence S over N periods and return the resulting rolling minimum sequence |
| HHVBARS | HHVBARS(S,N) | Return the number of periods between the current value and the highest value within the rolling N-period window |
| LLVBARS | LLVBARS(S,N) | Returns the number of periods between the current value and the lowest value within the rolling N-period window |
| MA | MA(S,N) | Calculate the N-period simple moving average of sequence S and return the moving average sequence |
| EMA | EMA(S,N) | Calculate the exponential moving average (EMA) of sequence S. To improve numerical accuracy, the input sequence should contain more than 4*N periods, and the EMA requires at least 120 periods of data, with alpha = 2/(span+1) |
| SMA | SMA(S,N,M=1) | This function uses the Chinese-style SMA algorithm. To ensure calculation accuracy, at least 120 historical periods of data are recommended (180 periods are used by Xueqiu). The smoothing factor is alpha = 1/(N+1) |
| WMA | WMA(S,N) | Calculate the N-day weighted moving average of sequence S,
Yn =
(1*X1+2*X2+3*X3+...+n*Xn)/(1+2+3+...+n) |
| DMA | DMA(S,A) | Calculate the dynamic moving average of S, using A as the smoothing factor. A must satisfy 0<A<1 |
| AVEDEV | AVEDEV(S,N) | Calculate the rolling mean absolute deviation of sequence S |
| SLOPE | SLOPE(S,N) | Calculate the slope of the linear regression model over the rolling N-period window of sequence S |
| FORCAST | FORCAST(S,N) | Calculate the predicted value of the linear regression model over the rolling N-period window of sequence S |
| LAST_ | LAST_(S,A,B) | Perform a BOOL check to determine whether the BOOL condition is satisfied continuously from A days ago to B days ago. The condition must satisfy A>B&A>0&B>=0 |
7.2 Application-Layer Functions (Implemented with Core Utility Functions)
| Function | Syntax | Description |
|---|---|---|
| COUNT | COUNT(S,N) | S is a Boolean sequence. Count the number of True values in the most recent N periods |
| EVERY | EVERY(S,N) | S is a Boolean sequence. Return whether all values in the most recent N periods are True |
| EXIST | EXIST(S,N) | S is a Boolean sequence. Return whether any value in the most recent N periods is True. |
| BARSLAST | BARSLAST(S) | S is a Boolean sequence. Return the number of periods since the previous True value up to the current period. |
| BARSLASTCOUNT | BARSLASTCOUNT(S) | S is a Boolean sequence. Count the number of consecutive periods in which the condition is met. |
| BARSSINCEN | BARSSINCEN(S,N) | S is a Boolean sequence. Return the number of periods from the first True value within the rolling N-period window to the current period |
| CROSS_ | CROSS_(S1,S2) | Determine whether two sequences cross. Use CROSS_(MA(C,5),MA(C,10)) to detect an upward golden cross, and CROSS_(MA(C,10),MA(C,5)) to detect a downward death cross. |
| LONGCROSS | LONGCROSS(S1,S2,N) | Determine whether two sequences cross after remaining in a specified relationship for a given number of periods. When N=1, it is equivalent to CROSS_(S1,S2). |
| VALUEWHEN | VALUEWHEN(S,X) | Return the current value of X when condition S is met; otherwise, return the value of X from the previous time S was met. |
| BETWEEN | BETWEEN(S,A,B) | Determine whether sequence S is between A and B. Return True when S lies between A and B, including A<S<B or A>S>B. |
| TOPRANGE | TOPRANGE(S) | Return the number of periods for which a given value in sequence S has been the highest value within the recent period. |
| LOWRANGE | LOWRANGE(S) | Return the number of periods for which a given value in sequence S has been the lowest value within the recent period. |
7.3 Technical Indicator Functions (Implemented Using Core Utility and Application Functions)
| Function | Syntax | Description |
|---|---|---|
| MACD | MACD(CLOSE,SHORT=12,LONG=26,M=9) | Moving average convergence/divergence |
| KDJ | KDJ(CLOSE,HIGH,LOW,N=9,M1=3,M2=3) | KDJ indicator |
| RSI | RSI(CLOSE,N=24) | RSI (Relative Strength Index); results are consistent with Tongdaxin to two decimal places. |
| WR | WR(CLOSE,HIGH,LOW,N=10,N1=6) | W&R Williams indicator |
| BIAS | BIAS(CLOSE,L1=6,L2=12,L3=24) | BIAS deviation rate |
| BOLL | BOLL(CLOSE,N=20,P=2) | BOLL indicator, Bollinger Bands |
| PSY | PSY(CLOSE,N=12,M=6) | PSY indicator, psychological line |
| CCI | CCI(CLOSE,HIGH,LOW,N=14) | CCI indicator, commodity channel index |
| ATR | ATR(CLOSE,HIGH,LOW,N=20) | N-day average true range |
| BBI | BBI(CLOSE,M1=3,M2=6,M3=12,M4=20) | BBI bull and bear index |
| DMI | DMI(CLOSE,HIGH,LOW,M1=14,M2=6) | DMI directional movement index |
| TAQ | TAQ(HIGH,LOW,N) | Donchian channel (Turtle) trading indicator |
| KTN | KTN(CLOSE,HIGH,LOW,N=20,M=10) | Keltner trading channel |
| TRIX | TRIX(CLOSE,M1=12,M2=20) | Triple exponential moving average |
| VR | VR(CLOSE,VOL,M1=26) | VR volume ratio |
| EMV | EMV(HIGH,LOW,VOL,N=14,M=9) | EMV ease of movement indicator |
| DPO | DPO(CLOSE,M1=20,M2=10,M3=6) | Range oscillator |
| BRAR | BRAR(OPEN,CLOSE,HIGH,LOW,M1=26) | BRAR-ARBR sentiment indicator |
| DFMA | DFMA(CLOSE,N1=10,N2=50,M=10) | DFMA parallel line difference indicator |
| MTM | MTM(CLOSE,N=12,M=6) | MTM momentum indicator |
| MASS | MASS(HIGH,LOW,N1=9,N2=25,M=6) | Mass index |
| ROC | ROC(CLOSE,N=12,M=6) | Rate of change indicator |
| EXPMA | EXPMA(CLOSE,N1=12,N2=50) | Exponential average indicator |
| OBV | OBV(CLOSE,VOL) | On-balance volume indicator |
| MFI | MFI(CLOSE,HIGH,LOW,VOL,N=14) | MFI money flow index |
| ASI | ASI(OPEN,CLOSE,HIGH,LOW,M1=26,M2=10) | Accumulation swing index |
8. Appendices
-
Python test code: PythonRunTime.py
-
Python MyTT library: MyTT.py
Performance test environment
-
CPU: Intel(R)Core(TM)i7-7700 CPU@3.60GHz 3.60 GHz
-
Total logical CPUs: 8
-
Memory: 32GB
-
OS: Windows 10