Stream
The Stream tab monitors the status of various stream computing tasks, including:
-
Subscriber and Publisher Status: Contains the status of workers on subscribers as well as the connection status between the local publisher and its subscribers. For details about each column, see getStreamingStat().subWorkers and getStreamingStat().pubConns.
-
Streaming Engine Status: Contains the status of various streaming engines. For details about each column, see getStreamEngineStat().
-
Stream Table Status: Contains the status of non-persisted and persisted shared stream tables. For details about each column, see getStreamTables.
Click the tabs at the top of the page to switch to the corresponding section. Click Refresh to refresh the content of the current tab.
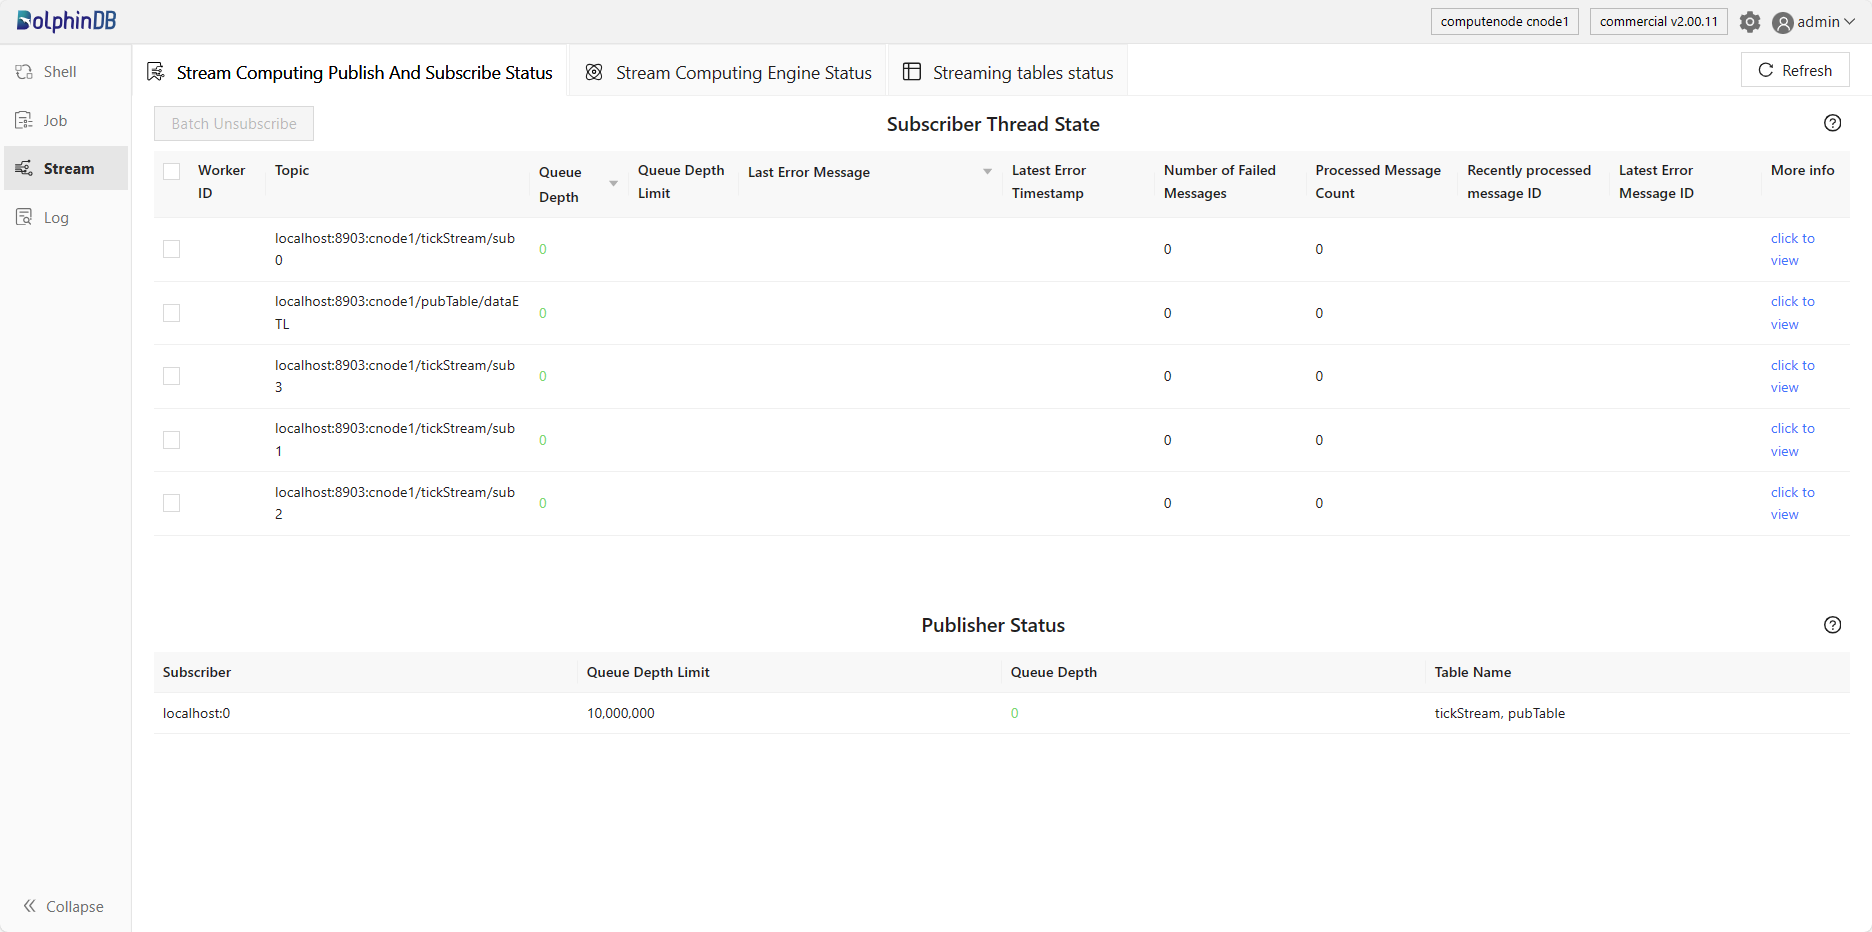
Subscriber and Publisher Status
Status of Workers on Subscribers
-
Displays worker ID, subscription topic, queue depth, queue depth limit, last error message, last error timestamp, number of error messages, number of processed messages, last message ID, and last error message ID.
-
Other information is stored in the "More Info" column. Click click to view to check the information in the pop-up window.
-
Different queue depth is displayed with different colors: green indicates 0; orange indicates 1-10000; red indicates 10000 and above.
-
The status of workers on subscribers can be sorted in descending order according to "Queue Depth" or "Last Error Message".
-
Error messages are briefly displayed and users can click to view related details.
Publisher Status
-
Subscriber: the IP address and port number of the subscriber node.
-
Queue Depth Limit: the maximum depth (number of records) of the message queue that is allowed on the publisher node.
-
Queue Depth: the current depth (number of records) of the message queue on the publisher node. Different queue depth is displayed with different colors: green indicates 0; orange indicates 1-10000; red indicates 10000 and above.
-
Table Name: the name of the persisted stream table on the publisher node.
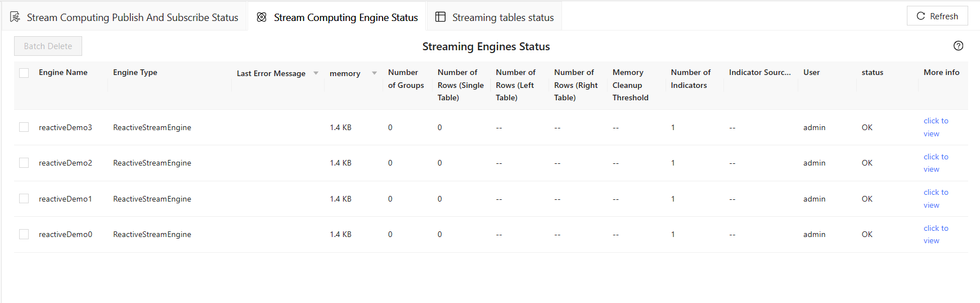
Streaming Engine Status
Through this tab, users can view the information of all streaming engines created by the system and delete them in batches.
-
Displays engine name, engine type, last error message, memory, number of groups, number of rows in a single table, number of rows in the left table, number of rows in the right table, garbage size, number of metrics, metacode of metrics, user, and status.
-
Other information is stored in the "More Info" column. Click click to view to check the information in the pop-up window.
-
Error messages are briefly displayed and users can click to view related details.
-
The status of streaming engines can be sorted in descending order according to "Memory".
-
Hover over the content in the "Metacode of Metrics" column to view the complete metacode.
Stream Table Status
Through this tab, users can view the status of shared stream tables, and persistence workers. They can also delete stream tables in batches.
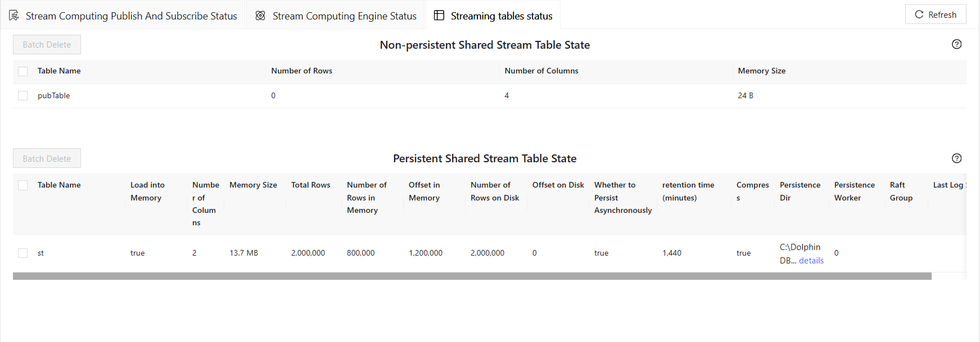
Non-persisted Shared Stream Table Status
-
Table Name: the name of the stream table.
-
Number of Rows: the number of rows in memory.
-
Number of Columns: the number of columns in the table.
-
Memory Size: the memory size of the table.
Persisted Shared Stream Table Status
-
Table Name: the name of the stream table.
-
Load into Memory: whether the table is loaded to memory.
-
Number of Columns: the number of columns in the table.
-
Memory Size: the number of records in memory.
-
Total Number of Rows: the total number of records in the stream table.
-
Number of Rows in Memory: the number of rows loaded to memory.
-
Offset in Memory: the offset position of the first message in memory relative to all records in the stream table. memoryOffset = totalSize - sizeInMemory.
-
Number of Rows on Disk: the number of records that have been persisted to disk.
-
Offset on Disk: the offset position of the first message on disk relative to all records in the stream table.
-
Enable Asynchronous Persistence: whether to persist data with asynchronous mode.
-
Retention Time: how long (in terms of minutes) the log file will be kept.
-
Compress: whether to save compressed data.
-
Persistence Directory: the path to the persistent data. Click details to view the complete directory.
-
Number of Persistence Workers: the number of workers responsible for persisting stream tables to disk in asynchronous mode.
-
Raft Group: the ID of the raft group to which the high-availability stream table belongs. The value is empty for normal stream tables.
-
Raft Log Seq: the latest log sequence number of raft log.
Persistence Worker Status
When the parameter asynWrite is set to true, the status of persistence workers will be displayed in this tab, which contains the following information:
-
Worker ID: the ID of the current persistence worker.
-
Queue Depth Limit: the maximum depth (number of records) of the message queue to persist a stream table to disk.
-
Queue Depth: the current depth (number of records) of the message queue to persist a stream table to disk. Different queue depth is displayed with different colors: green indicates 0; orange indicates 1-10000; red indicates 10000 and above.
-
Table Name: the name of the stream table that has been persisted to disk.