Cluster
On the Compute Group Configuration tab, you can view, modify, add, and delete configurations of existing compute groups.
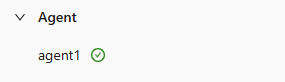
Agent Panel
The agent panel displays the name and state of agent nodes.
Toolbar

- Click ⟳ to refresh the status of nodes.
- Click ▶ to start the selected data nodes.
- Click ⏹ to stop the selected data nodes.
To filter nodes by their names, enter the text in the box to the right of 🔄 and then click Enter.
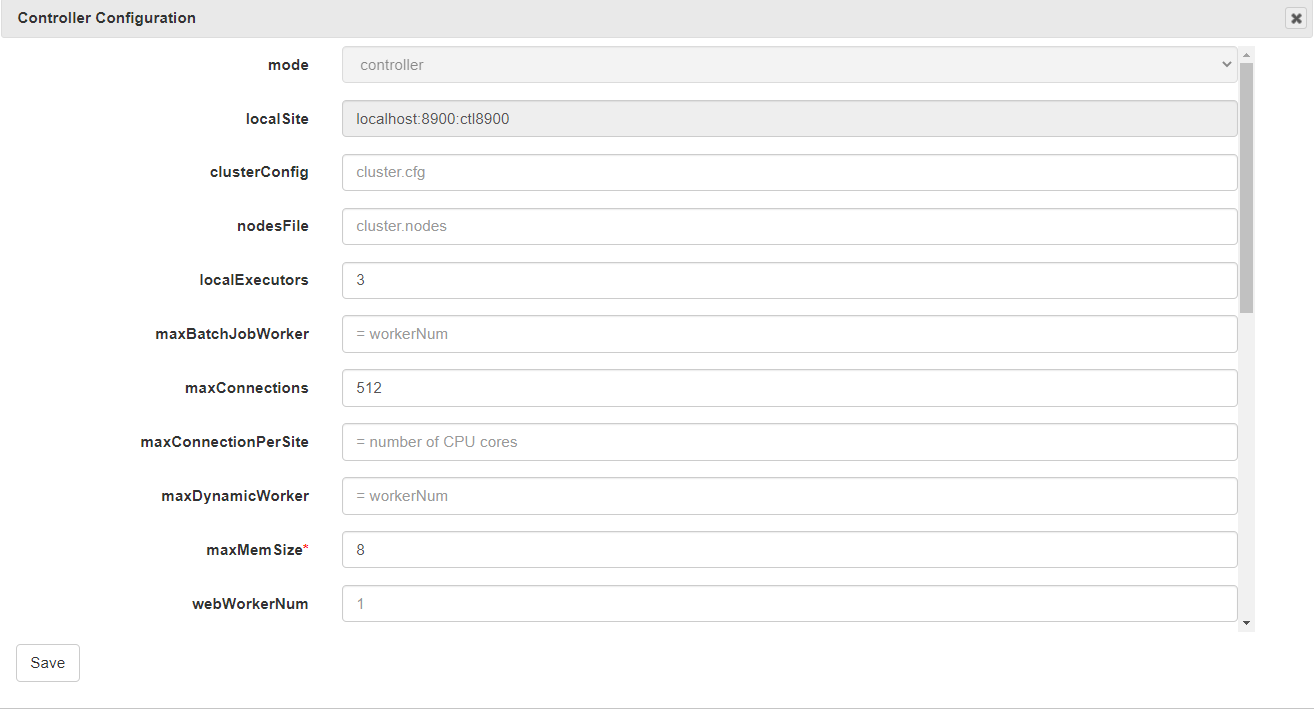
Click Controller Config to view and modify the configuration parameters for the controller, which is equivalent to modifying the controller.cfg file. Note the configuration takes effect only after the controller is rebooted.
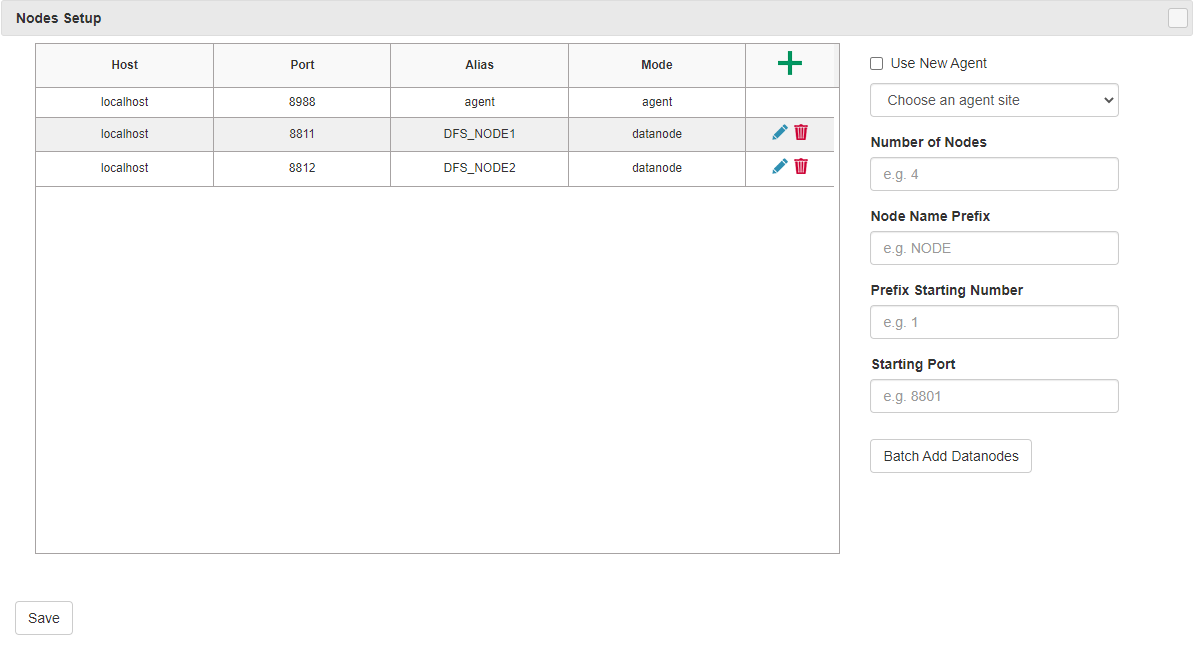
Click Nodes Setup to check the cluster environment. You can add, delete or edit data nodes, which is equivalent to modifying the cluster.nodes file.
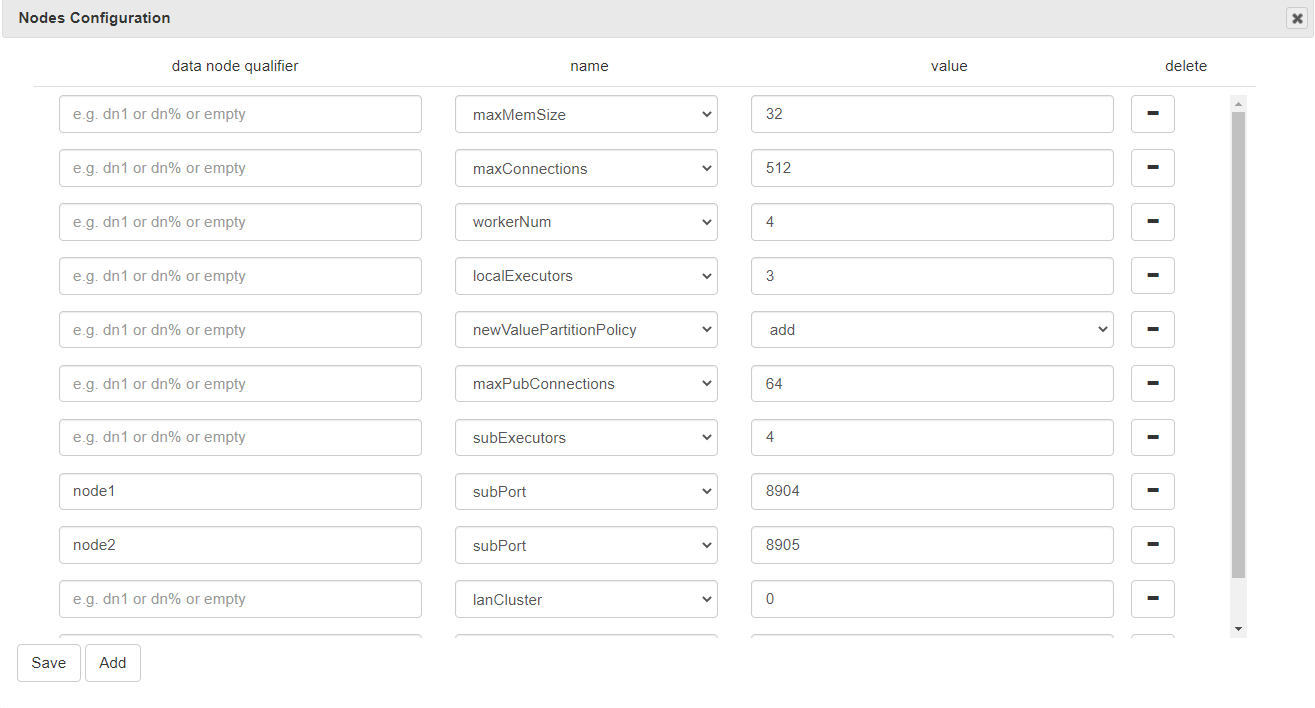
Click Nodes Config to view, add, modify or delete the configuration parameters, which is equivalent to modifying the cluster.cfg file.
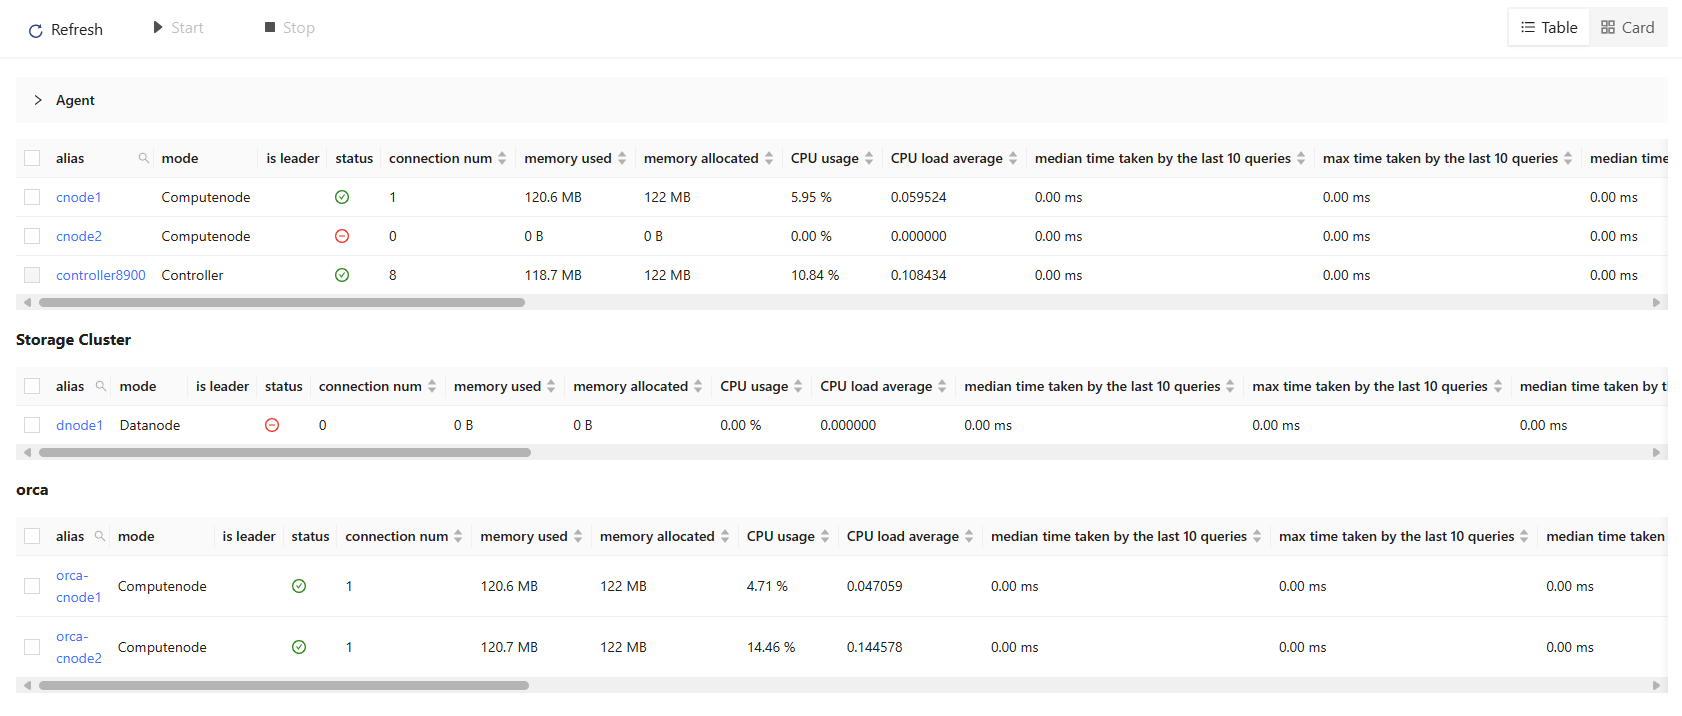
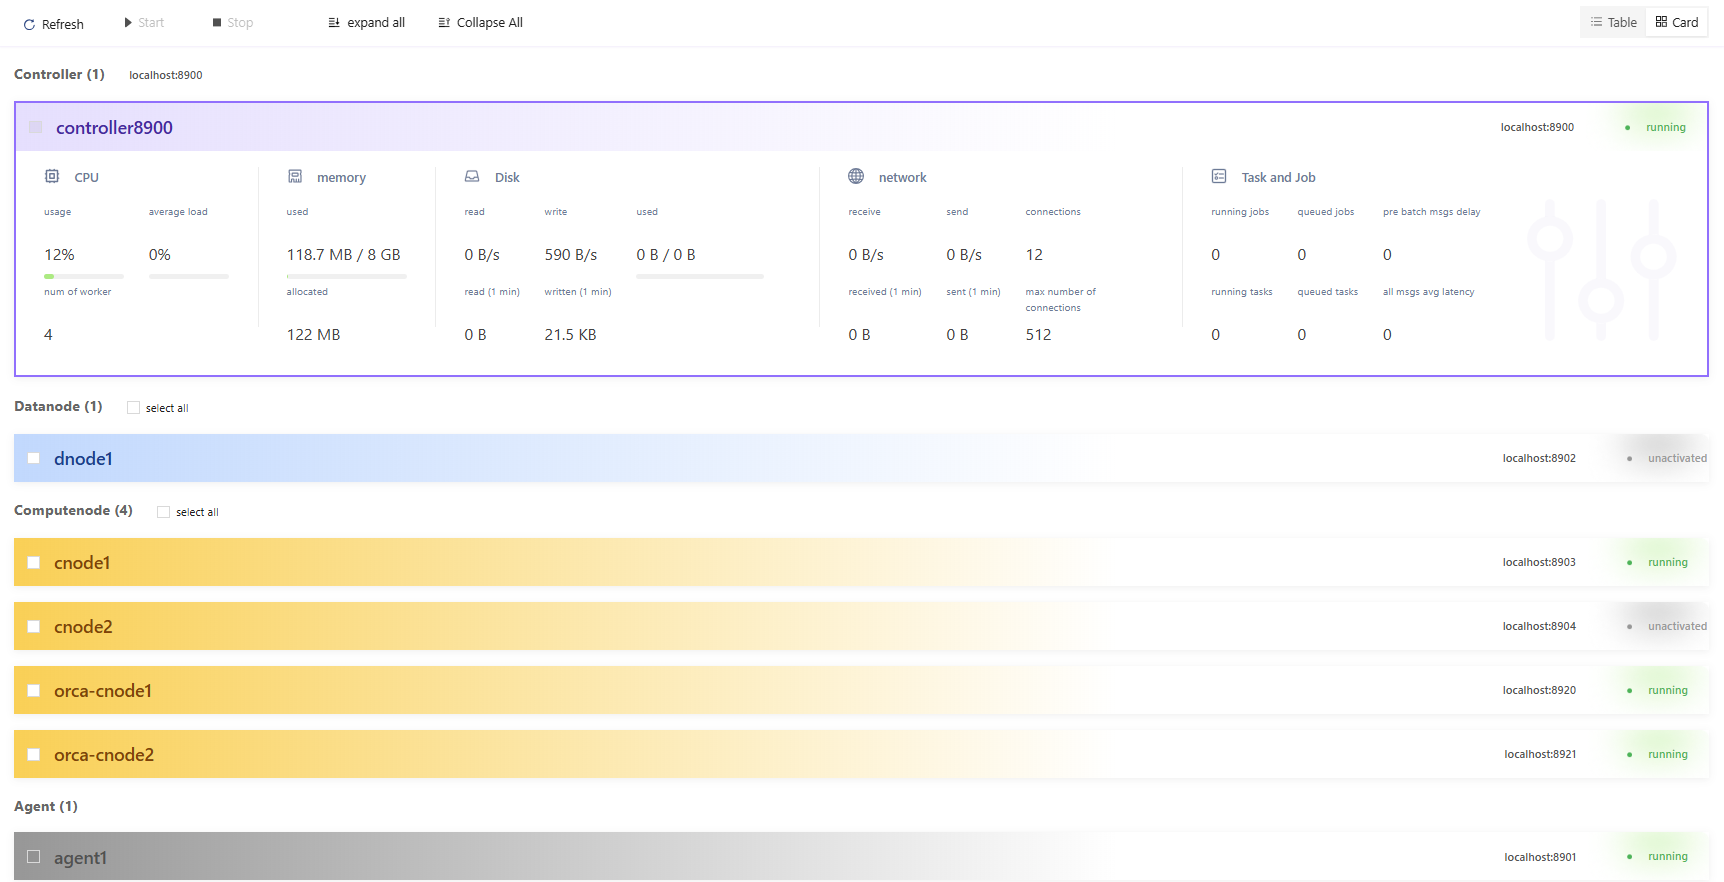
Performance Monitoring Panel
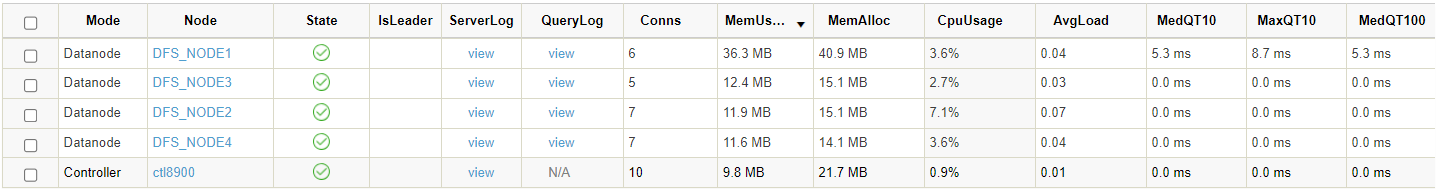
The performance monitoring panel displays various performance indicators for the controller and data nodes.
To customize which indicators to display, right click the panel and click Column Selection.
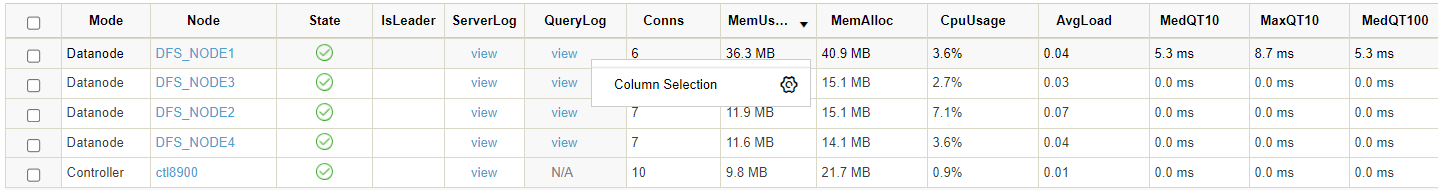
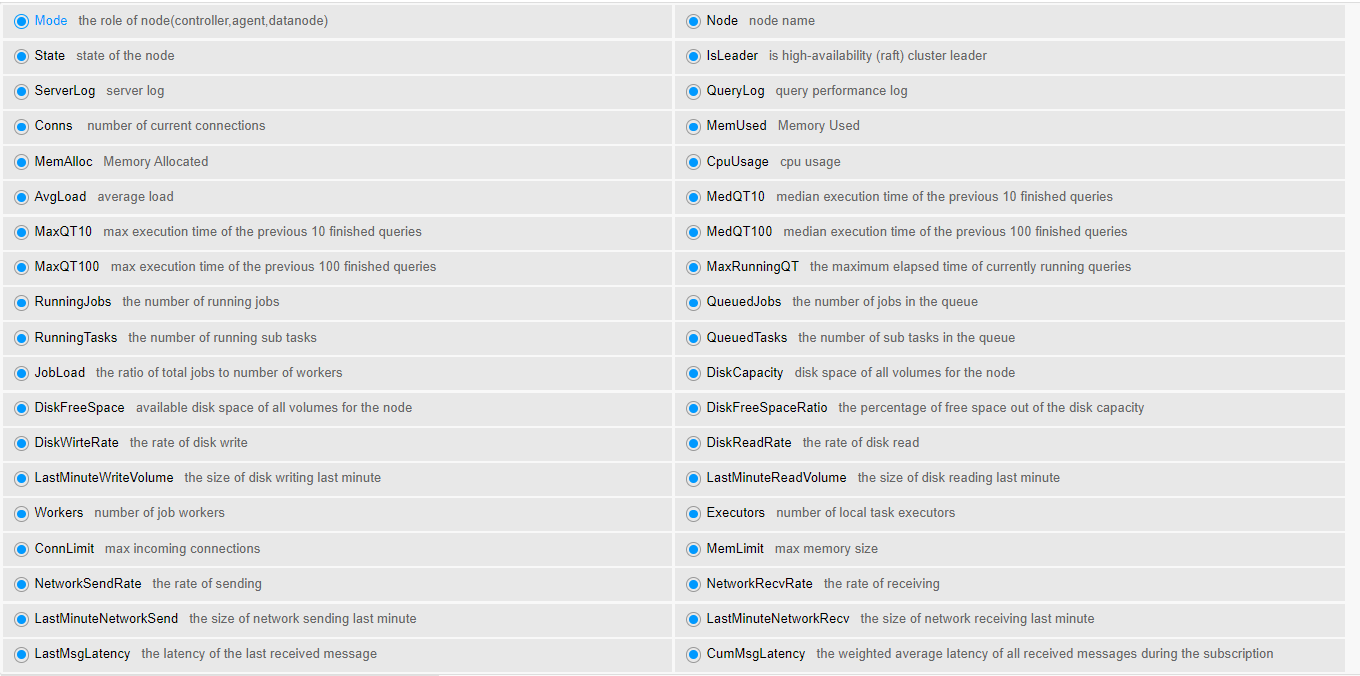
You can also drag to change the order of columns in the panel.
To check the ServerLog or QueryLog of a particular node, click view in these 2 columns.
