Shell
This section mainly introduces the specific functions of the Shell interface, which
contains the editor, variable browser, data browser, log browser, and database browser.
To use the Shell interface, click To log in on databse browser or use the
login function to log in. To log out, use the
logout function or click the Log out button in the upper
right corner. Note that when using logout, the system will
automatically log users in again after a page refresh, while the Log out button
enables users to completely exit the session.
Editor
The script in the editor can be executed by clicking the ▶ icon in the upper left corner or pressing Ctrl+E. Select a part (or all) of the script, and click ▶ or press Ctrl+E to execute the selected script. If no script is selected, clicking ▶ will execute the entire script. You can also click a line and press Ctrl+E to execute only this line of script.
a = array(STRING,10).append!(string(concat(take(`abcdefg01234,100005))))
print a
Variable Browser
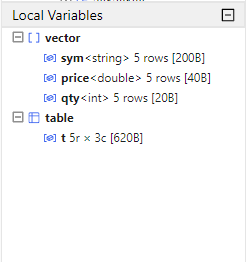
The variable browser in the web interface displays the name, data type, and size of variables in each data form.
It is very similar to that in GUI. Their only difference is that you can right click variables in GUI to conduct operations such as undefine, check schema, etc, while the web interface doesn't offer these functionalities.
Select a vector, matrix, or in-memory table in the variable browser to view the data. For a DFS table, you can check the data in the database browser.
Data Browser
The data browser in the web interface displays the execution results of the script in the editor.
For example, execute the following script in the editor window:
sym = `C`MS`BAC`BK`WFC
price= 75.67 53.24 29.48 54.42 60.92
qty = 2200 1900 2100 3200 1800
t = table(sym, qty, price)
select *, price*qty as volume from t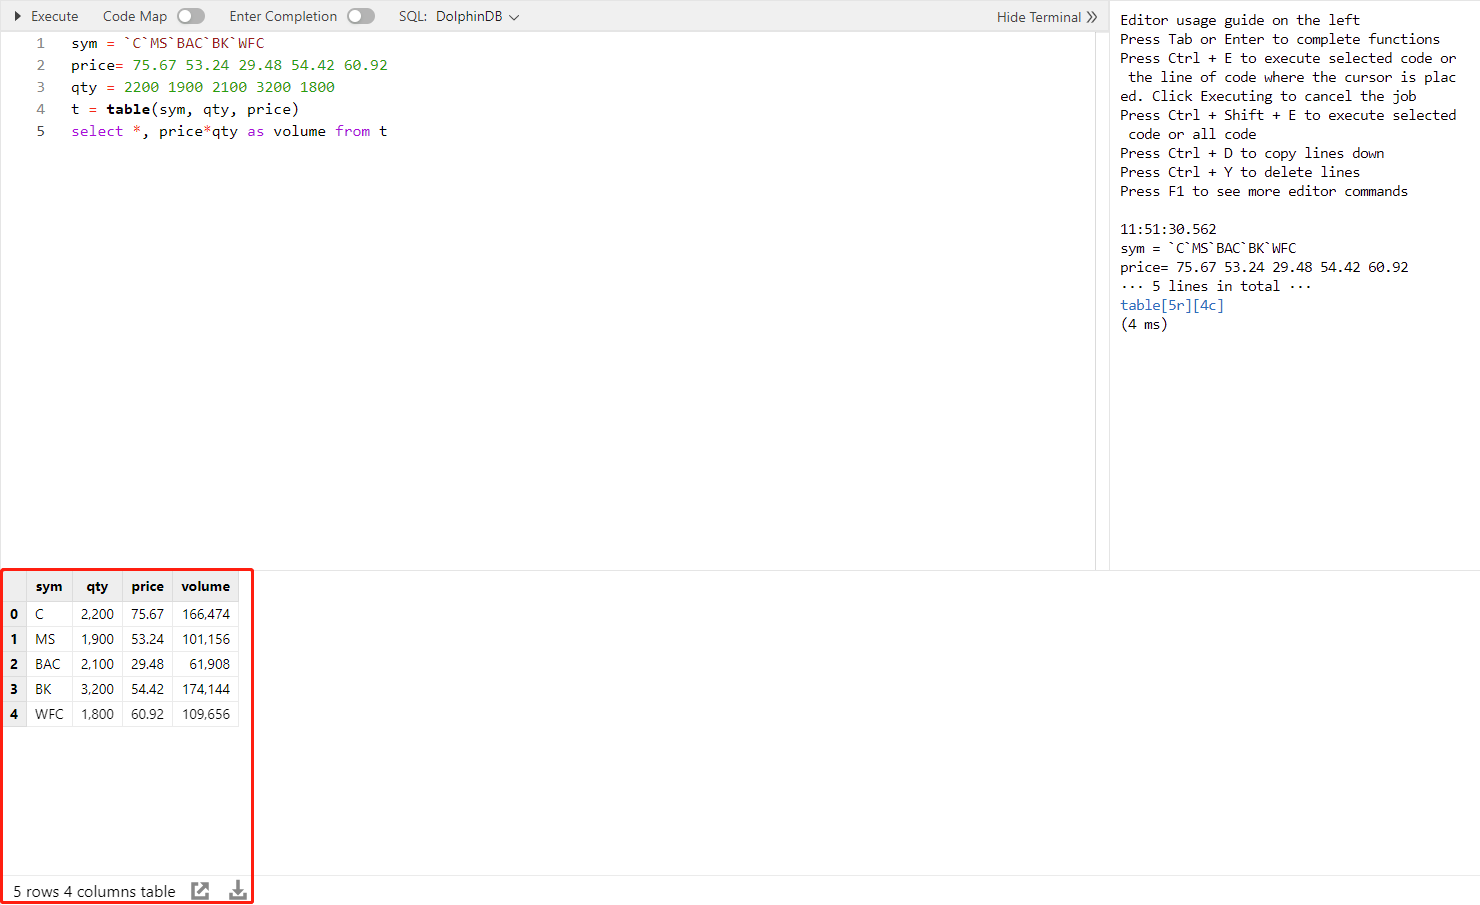
It is very similar to that in GUI except for the following differences:
-
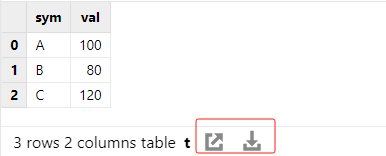
In the GUI, you can right-click in the data browser to perform various operations such as copying, sorting, and exporting. In the web interface, you can copy text by selecting it, but sorting data isn't supported. To view results in a new window, click the "Open in new window" icon in the lower left corner. If you need to export data, click the "export CSV" icon.
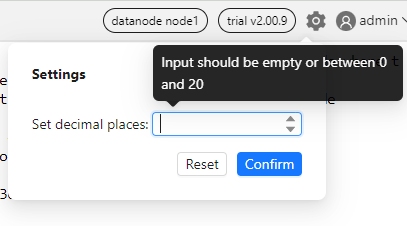
To set decimal places of results displayed in data browser, you can click the "Settings" icon in the upper right corner.
Log Browser
The log browser displays the completion time, elapsed time, execution results in scalar form, and error information of each execution.
Execution results in scalar form will be displayed in the log browser. Results in other forms will be displayed in the data browser.
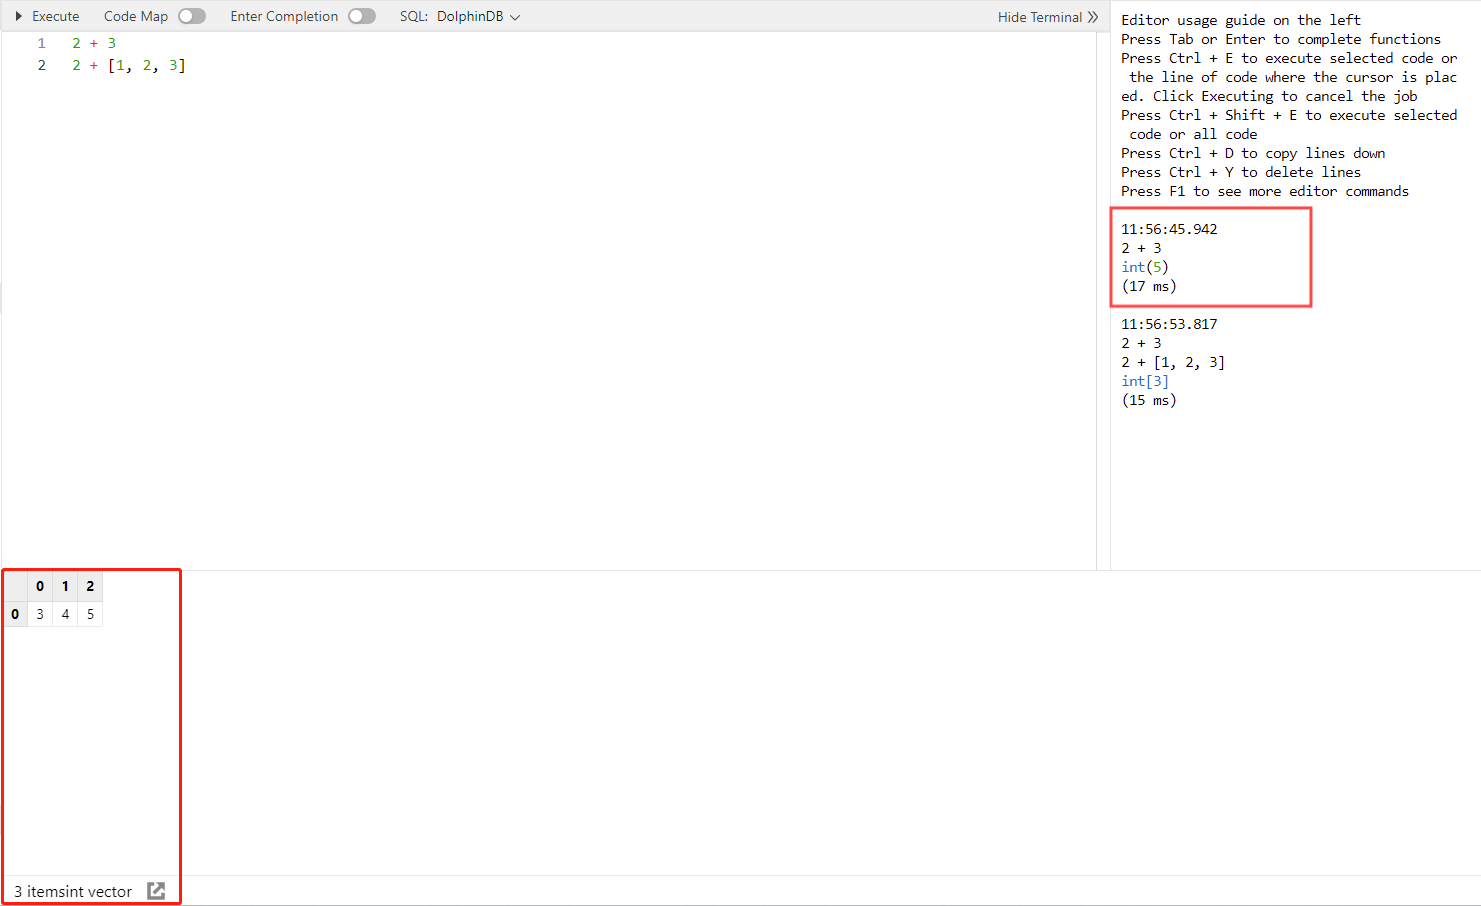
In the following example, the result of 2 + 3, as a scalar, is
displayed in the log browser. The result of 2 + [1, 2, 3], as a
vector, is displayed in the data browser
-
Currently messages in the log browser cannot be cleared.
-
The log browser can output up to 100,000 logs.
Database Browser
The database browser features the following functionalities:
-
Create databases and tables;
-
Add columns (with comments) to a table;
-
Display information about the created databases and their tables.
In the DolphinDB web interface, users can create databases or tables by conditions or scripts.
Create databases and tables by conditions
-
Create databases
Click the
 icon to open the Create database
window.
icon to open the Create database
window.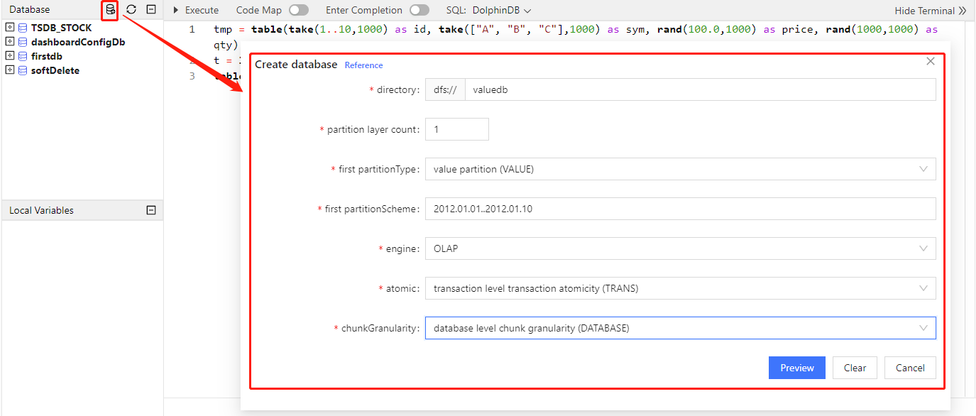
Click Clear to clear the filled content or Cancel to cancel the creation.
Click Preview to view the corresponding script:
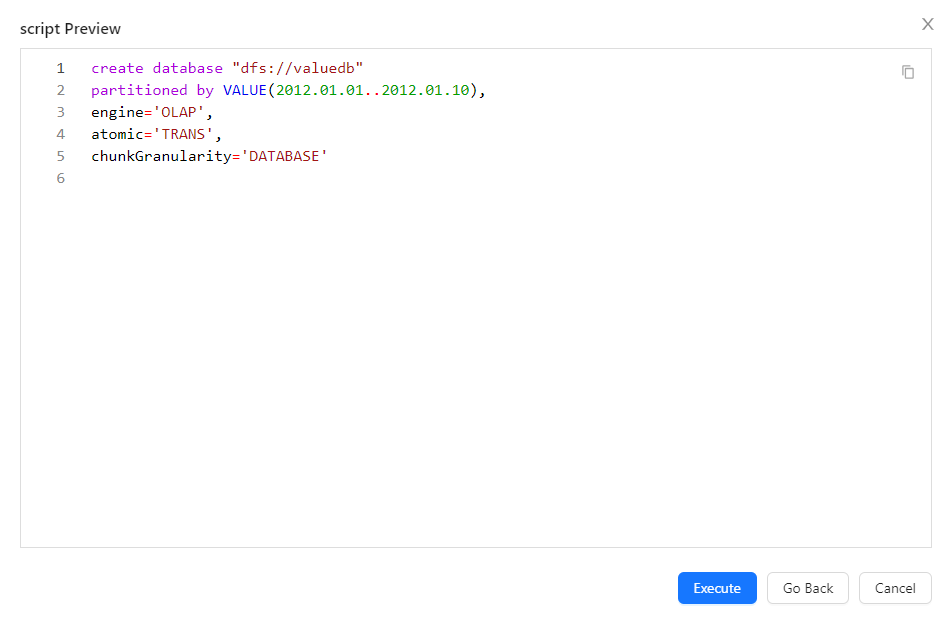
Click Cancel to cancel the creation or Go Back to return to the Create database window page. Click Execute and the database is shown in the database browser if the script is correct, otherwise an error message is returned.
-
Create tables
Hover over the database name in the browser and you can see the
 icon on the right.
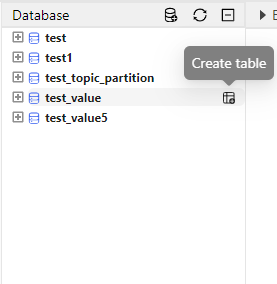
Click the icon to open the Create table window:
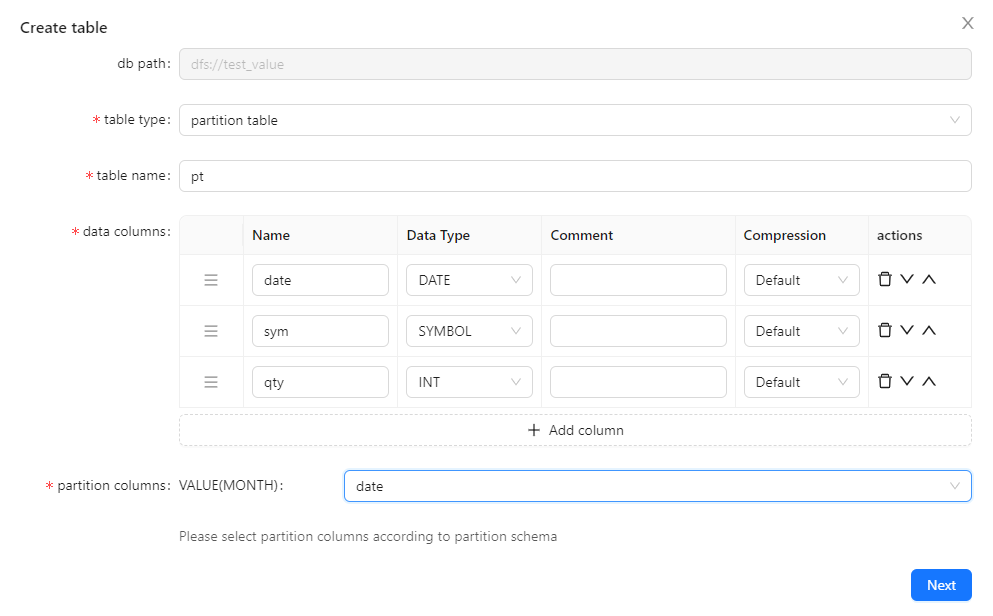
Fill the required fields and click Next to view the corresponding script:
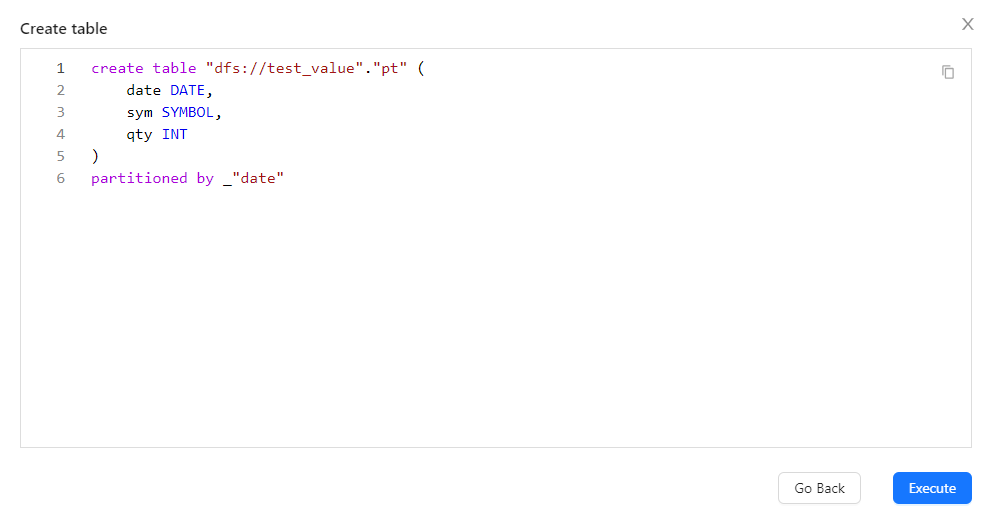
Click the
 icon in the upper right corner to copy the script.
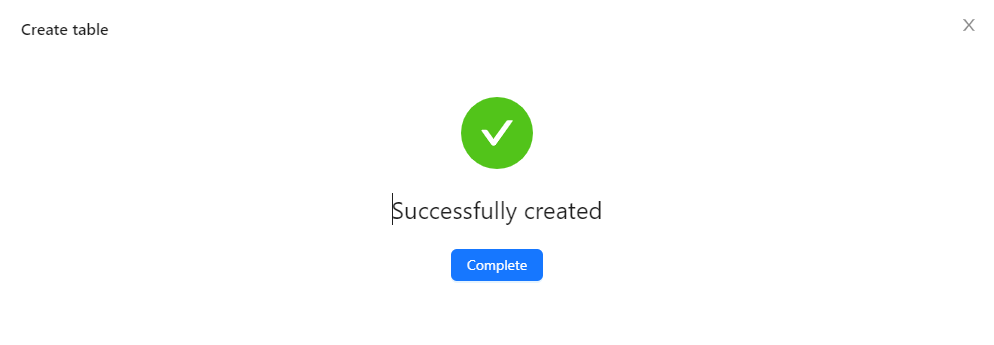
Click Go Back to return to the Create table window or Execute to create the table. If the table is created successfully, the following message is shown:
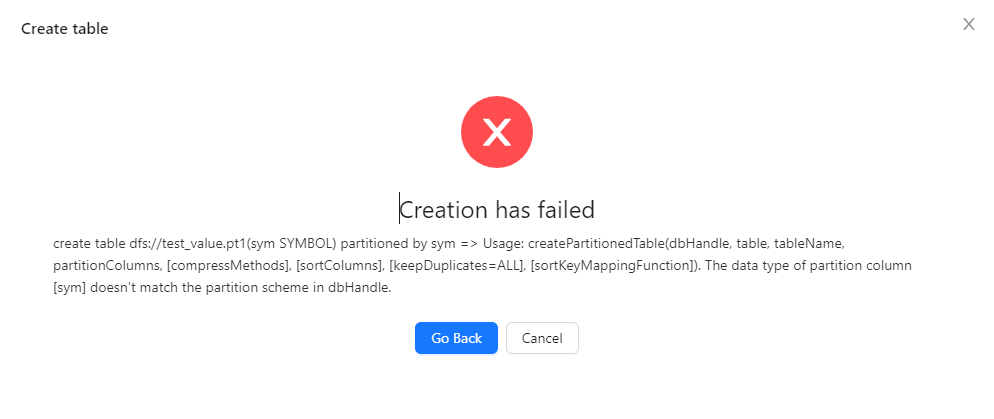
Otherwise, the error message is displayed:
-
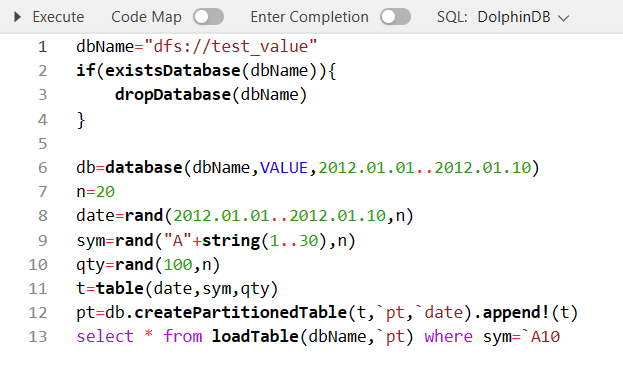
Create databases and tables by scripts
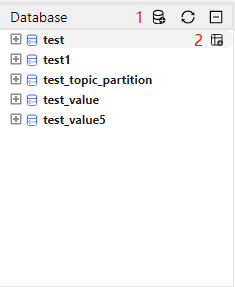
You can also create databases and tables directly by entering the corresponding script in the editor. After successful creation, click the 🔁 icon in the upper left corner of database browser to view the database/table.
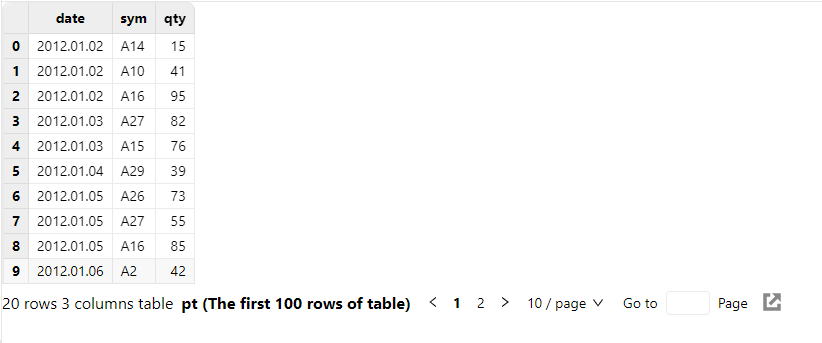
Example: execute the following script in the editor to create a DFS table pt.
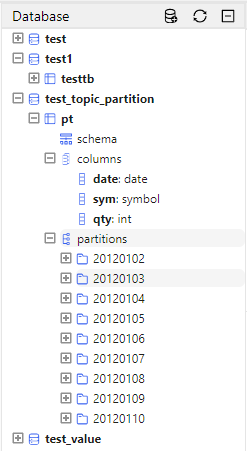
dbName="dfs://test_topic_partition"
if(existsDatabase(dbName)){
    dropDatabase(dbName)
}
db=database(dbName,VALUE,2012.01.01..2012.01.10)
n=20
date=rand(2012.01.01..2012.01.10, n)
sym=rand("A"+string(1..30), n)
qty=rand(100, n)
t=table(date, sym, qty)
pt=db.createPartitionedTable(t, `pt, `date).append!(t)
Click the ➕ icon before the table name to show the table schema, column names and types, and partitions. Click the ➖ icon to collapse the displayed information.
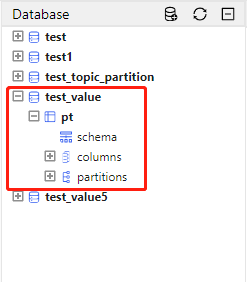
Click table pt and the table is displayed in the data browser:
Hover over the columns and you can see the
 icon. Click the icon to add a new column:
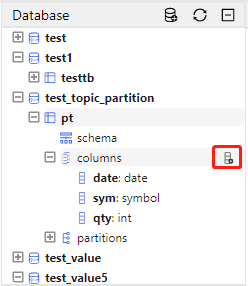
Hover over a column of pt and you can see the
 icon. Click the icon to add comments to the column:
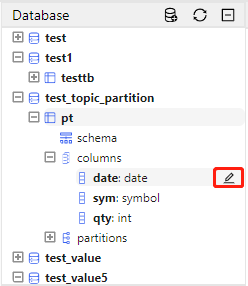
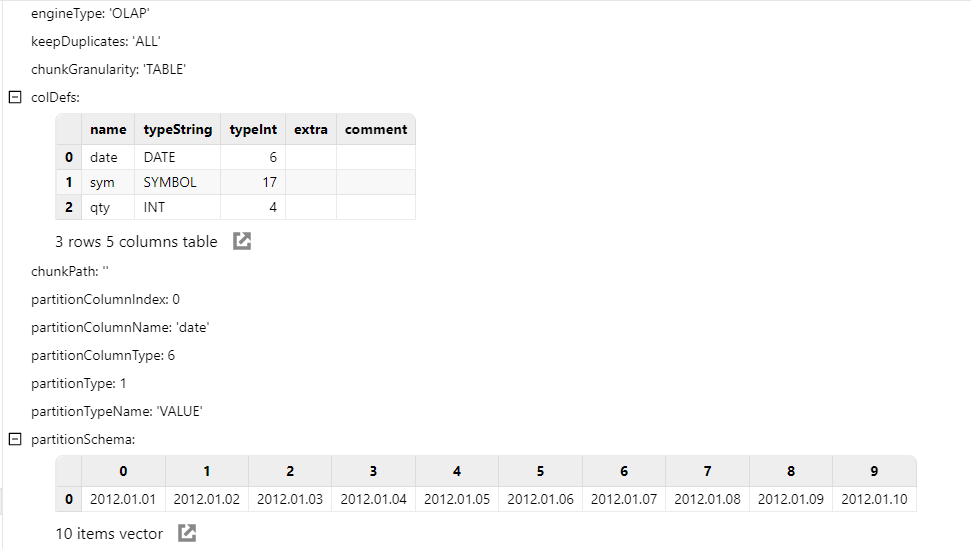
Click the schema of pt and the table schema is displayed in the data browser:
Click partitions, select a partition, and the data of the partition is displayed in the data browser:
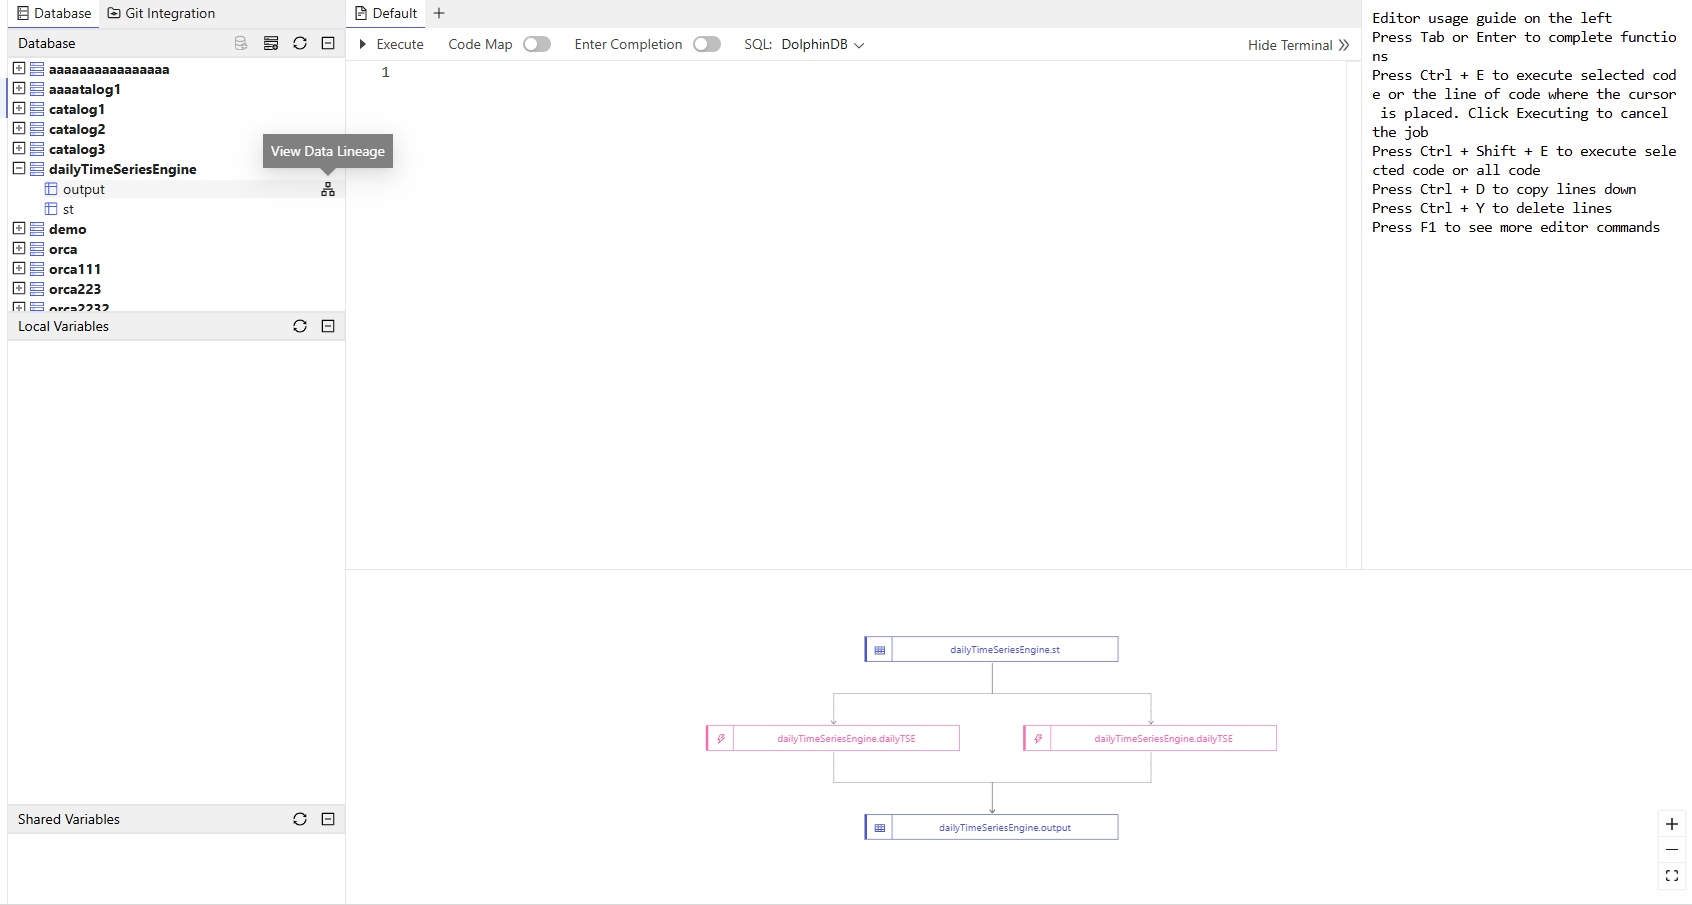
 Hover over the an Orca table and you can see the
 icon, which you
can click to query Data Lineage of stream graph tables.Note:
icon, which you
can click to query Data Lineage of stream graph tables.Note:If the productKey is not ORCA, the feature needs to be enabled by the admin in the Feature Settings page.
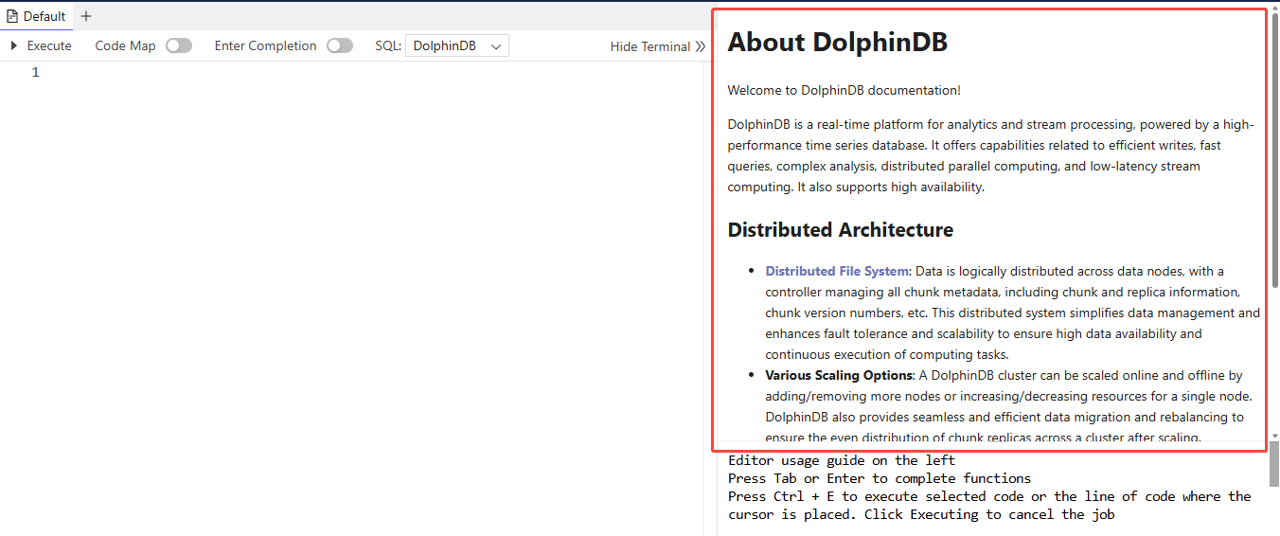
Markdown Panel
With the Markdown panel, you can present diverse text, documentation, and interactive content using Markdown format.
By defining the function getMarkdownStr and adding it to the view
(for admin logins only), you can see the rendered panel on the right side of the
Shell, which supports resizing by dragging both vertically and
horizontally.
db=database("dfs://webNotice",HASH,[STRING,2])
tb=table(1:0,["info","addTime"],[STRING,TIMESTAMP])
dt=db.createTable(tb,"data")

dt.append!(table('# About DolphinDB

Welcome to DolphinDB documentation!

DolphinDB is a real-time platform for analytics and stream processing, powered by a high-performance time series database. It offers capabilities related to efficient writes, fast queries, complex analysis, distributed parallel computing, and low-latency stream computing. It also supports high availability.

## Distributed Architecture

- [**Distributed File System**](https://docs.dolphindb.com/en/Tutorials/database.html): Data is logically distributed across data nodes, with a controller managing all chunk metadata, including chunk and replica information, chunk version numbers, etc. This distributed system simplifies data management and enhances fault tolerance and scalability to ensure high data availability and continuous execution of computing tasks.
- **Various Scaling Options**: A DolphinDB cluster can be scaled online and offline by adding/removing more nodes or increasing/decreasing resources for a single node. DolphinDB also provides seamless and efficient data migration and rebalancing to ensure the even distribution of chunk replicas across a cluster after scaling.
- **Distributed Transaction**: DolphinDB guarantees [ACID](https://docs.dolphindb.com/en/Tutorials/database.html#52-transactions) (atomicity, consistency, isolation, and durability) and supports snapshot isolation.
- **High Availability**: To maintain stable service and business continuity against single-node failure, DolphinDB offers high availability solutions for controllers, data nodes, and clients.
- **Comprehensive Backup and Recovery**: The backup and recovery mechanism is flexible and can be tailored to specific needs, ensuring data security.
- **Cluster Replication**: With low latency, high throughput, and high fault tolerance, this solution enables asynchronous data replication across clusters, enhancing datasecurity.
' as info,now() as addTime))

def getMarkdownStr(){
  return (exec info from loadTable("dfs://webNotice","data") order by addTime desc limit 1)[0]
}
addFunctionView(getMarkdownStr)
getFunctionViews()


// Delete the defined function view and database
dropFunctionView(`getMarkdownStr)
dropDatabase("dfs://webNotice")