gp
The DolphinDB gp plugin can be used to plot vectors and tables and save the generated plots locally. The plugin is developed based on Gnuplot, a command-line driven graphing utility.
Installation (with installPlugin)
Required server version: DolphinDB 2.00.10 or higher
Supported OS: Linux X86-64, Linux ABI
Installation Steps:
(1) Use listRemotePlugins to check plugin information in the plugin repository.
Note: For plugins not included in the provided list, you can install through precompiled binaries or compile from source. These files can be accessed from our GitHub repository by switching to the appropriate version branch.
login("admin", "123456") listRemotePlugins("gp")(2) Invoke installPlugin for plugin installation.
installPlugin("gp")(3) Use loadPlugin to load the plugin before using the plugin methods.
loadPlugin("gp")Method References
plot
Syntax
plot(data, style, path, [props])Details
Plot based on the data from DolphinDB and save the generated plots locally in EPS/PNG/JPEG format.
Parameters
data: A vector, a tuple of vectors, or a table containing data used for plotting. If it is a table, the first and second columns are used as the X-axis and Y-axis data respectively.
style: A STRING scalar indicating the style of the plot, which can be "line", "point", "linesoint", "impulses", "dots", "step", "errorbars", "histogram", "boxes", "boxerrorbars", "ellipses", and "circles".
path: A STRING scalar indicating the path where the plot will be saved. Currently, the generated plot can be saved in EPS/PNG/JPEG format by specifying the suffix of path as ".eps", ".png", or ".jpeg". If no file extension is specified, the plot will be saved in EPS format.
props: A dictionary indicating the properties of the plot, which includes the following key-value pairs:
title: A STRING scalar/vector indicating the identifier for each data group.
xRange: A numeric vector of length 2, indicating the X-axis range of the plot.
yRange: A numeric vector of length 2, indicating the Y-axis range of the plot.
xLabel: A STRING scalar indicating the label for the X-axis.
yLabel: A STRING scalar indicating the label for the Y-axis.
size: A numeric vector of length 2, indicating the scale of the plot (initial length: 1). The two elements respectively represent the width and height ratio.
xTics: A numeric scalar indicating the interval of X-axis ticks.
yTics: A numeric scalar indicating the interval of Y-axis ticks.
resolution: An INT vector indicating the resolution of the plot, which should be specified for plots in PNG and JPEG format.
The following properties can be set for each plot:
lineColor: A STRING scalar indicating the line color, which can be "black", "red", "green", "blue", "cyan", "magenta", "yellow", "navy", "purple", "olive", "orange", "violet", "pink", "white", and "gray".
lineWidth: A numeric scalar/vector indicating the line width.
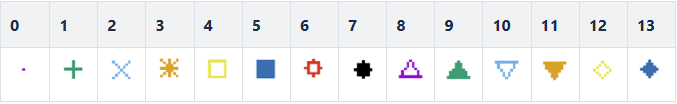
pointType: An INT scalar/vector indicating the point shape, with values ranging from 0 to 13. The shape corresponding to each value is as follows:
pointSize: A numeric scalar/vector indicating the point size.
smooth: A STRING scalar/vector indicating the data smoothness, which can be "csplines" or "bezier".
Examples
data=(rand(20,20),rand(20,20),rand(20,20),rand(20,20),rand(20,20),rand(20,20),rand(20,20),rand(20,20),rand(20,20),rand(20,20),rand(20,20),rand(20,20),rand(20,20),rand(20,20),rand(20,20))
prop=dict(STRING,ANY)
prop[`lineColor]=["black", "red", "green", "blue", "cyan", "magenta", "yellow", "navy", "purple", "olive",  "orange", "violet", "pink", "white", "gray"]
prop["xTics"]=2
prop["yTics"]=5
prop["title"]="l"+string(1..15)
re = gp::plot(data,"line",WORK_DIR+"/test.eps",prop)
re = gp::plot(data,"line",WORK_DIR+"/test.png",prop)
re = gp::plot(data,"line",WORK_DIR+"/test.jpeg",prop)