
cmFutVolatilitySurfaceBuilder
首发版本:3.00.5
语法
cmFutVolatilitySurfaceBuilder(referenceDate, futMaturities, optionExpiries,
                    strikes, optionPrices, payoffTypes, discountCurve, futPriceCurve,
                    [formula="Black76"], [model="SVI"], [surfaceName])
详情
构建商品期货期权波动率曲面。
参数
注:所有输入向量必须等长。
referenceDate DATE 类型标量,表示参考日期,即曲线的生成日期。
futMaturities DATE 类型向量,表示标的期货合约的到期日。
optionExpiries DATE 类型向量,表示期权合约的到期日。注:optionExpiries 中的每个日期必须早于或等于 futMaturities 中对应位置的标的期货到期日。
strikes 元组,其中每个元素是一个 DOUBLE 类型向量,表示期权合约的执行价。
optionPrices 元组,其中每个元素是一个 DOUBLE 类型向量,表示期权合约价格。
payoffTypes 元组,其中每个元素是一个 STRING 类型向量, 表示期权类型,可选 “Call”(看涨)或 “Put”(看跌)。
注:strikes、optionPrices、payoffTypes 每个对应位置的向量元素长度相同。
discountCurve IrYieldCurve 对象,表示折现曲线。
futPriceCurve AssetPriceCurve 对象,表示期货价格曲线。
formula 可选参数,STRING 类型标量,表示计算隐含波动率的公式,可选值为:
-
“Black76”:默认值,Black76 公式,一般用于欧式期权
-
“BAW”:Barone-Adesi-Whaley 公式,一般用于美式期权
model 可选参数,STRING 类型标量,指定构建波动率曲面所用模型。支持以下选项:
-
“SVI”:默认值,Stochastic Volatility Inspired 模型
-
“SABR”:Stochastic Alpha Beta Rho 模型
-
“Linear”:线性模型
-
“CubicSpline”:三次样条模型
surfaceName 可选参数,STRING 类型标量,表示曲面名称。
返回值
一个 MKTDATA 类型 VolatilitySurface 对象。
例子
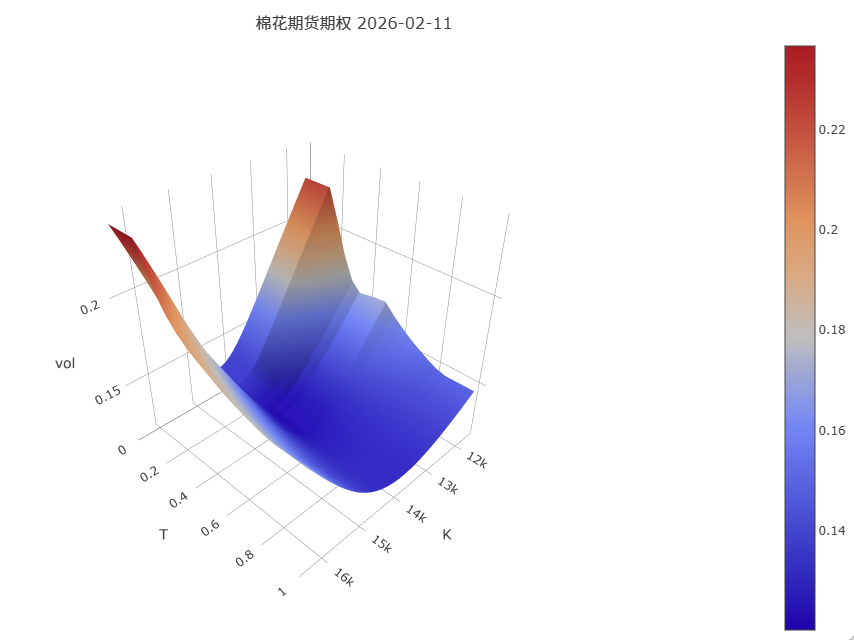
例1. 下例展示如何使用棉花期货期权市场数据构建波动率曲面,并通过三维图表可视化波动率随到期时间和行权价的变化趋势:
// CF 棉花期货期权波动率曲面构建示例

// 曲线构建的参考日期
referenceDate = 2026.02.11
// 期权到期日
optionExpiries = [2026.04.13,2026.06.11,2026.08.12,2026.12.11]
// 标的期货合约到期日(与期权到期日一一对应)
futMaturities  = [2026.05.22,2026.07.17,2026.09.17,2027.01.19]
// strikes: list of strike vectors (每个期权到期日对应一组 strikes)
strikes = [
    [11600.0,11800.0,12000.0,12200.0,12400.0,12600.0,12800.0,13000.0,13200.0,13400.0,13600.0,13800.0,14000.0,14200.0,14400.0,14600.0,14800.0,15000.0,15200.0,15400.0,15600.0,15800.0,16000.0,16200.0,16400.0],
    [13200.0,13400.0,13600.0,13800.0,14000.0,14200.0,14400.0,14600.0,14800.0,15000.0,15200.0,15400.0,15600.0,15800.0,16000.0,16200.0,16400.0],
    [12200.0,12400.0,12600.0,12800.0,13000.0,13200.0,13400.0,13600.0,13800.0,14000.0,14200.0,14400.0,14600.0,14800.0,15000.0,15200.0,15400.0,15600.0,15800.0,16000.0,16200.0,16400.0,16600.0],
    [13600.0,13800.0,14000.0,14200.0,14400.0,14600.0,14800.0,15000.0,15200.0,15400.0,15600.0,15800.0,16000.0,16200.0,16400.0,16600.0]
]

// optionPrices: 每个到期日对应的 option price 向量
optionPrices = [
    [2.0,2.0,3.0,4.0,6.0,8.0,10.0,14.0,20.0,28.0,40.0,57.0,84.0,125.0,187.0,276.0,299.0,240.0,200.0,171.0,149.0,133.0,118.0,107.0,98.0],
    [35.0,49.0,69.0,99.0,145.0,212.0,303.0,416.0,422.0,367.0,321.0,285.0,251.0,226.0,200.0,182.0,164.0],
    [23.0,28.0,33.0,41.0,51.0,64.0,82.0,106.0,140.0,189.0,255.0,340.0,444.0,563.0,503.0,451.0,408.0,372.0,342.0,313.0,291.0,269.0,249.0],
    [147.0,185.0,234.0,290.0,362.0,446.0,540.0,653.0,772.0,713.0,658.0,617.0,580.0,546.0,523.0,500.0]
]

// payoffTypes: 期权类型,用字符串 "Put"/"Call" 表示
payoffTypes = [
    ["Put","Put","Put","Put","Put","Put","Put","Put","Put","Put","Put","Put","Put","Put","Put","Put","Call","Call","Call","Call","Call","Call","Call","Call","Call"],
    ["Put","Put","Put","Put","Put","Put","Put","Put","Call","Call","Call","Call","Call","Call","Call","Call","Call"],
    ["Put","Put","Put","Put","Put","Put","Put","Put","Put","Put","Put","Put","Put","Put","Call","Call","Call","Call","Call","Call","Call","Call","Call"],
    ["Put","Put","Put","Put","Put","Put","Put","Put","Put","Call","Call","Call","Call","Call","Call","Call"]
]

// 构建折现曲线
discountCurve = parseMktData({
    "mktDataType": "Curve", "curveType": "IrYieldCurve", "referenceDate": referenceDate,
    "currency": "CNY", "dayCountConvention": "Actual365", "compounding": "Continuous",
    "interpMethod": "Linear", "extrapMethod": "Flat",
    "dates": [referenceDate+1, referenceDate+365], "values": [0.02, 0.02], "name": "CONST_IR"
})

// 商品远期曲线
futPriceCurve = parseMktData({
    "mktDataType": "Curve", "curveType": "AssetPriceCurve", "referenceDate": referenceDate,
    "dates": [2026.05.22,2026.07.17,2026.09.17,2027.01.19], "values": [14705.0,14675.0,14800.0,15200.0]
})

// 构建波动率曲面
surf = cmFutVolatilitySurfaceBuilder(referenceDate, futMaturities, optionExpiries, strikes, optionPrices, payoffTypes, discountCurve, futPriceCurve, formula='Black76', model='SVI', surfaceName='CF_surface');
print(surf);

// 生成波动率预测数据用于可视化
dts = (0..20)*0.05
ks = (0..40)*((max(strikes[0])-min(strikes[0]))\40)+min(strikes[0])
m = optionVolPredict(surf, dts, ks).rename!(dts, ks)

// 绘制曲面图
plot(
    m,
    title=["棉花期货期权 2026-02-11", "K", "T", "vol"],
    chartType=SURFACE)
输出返回:
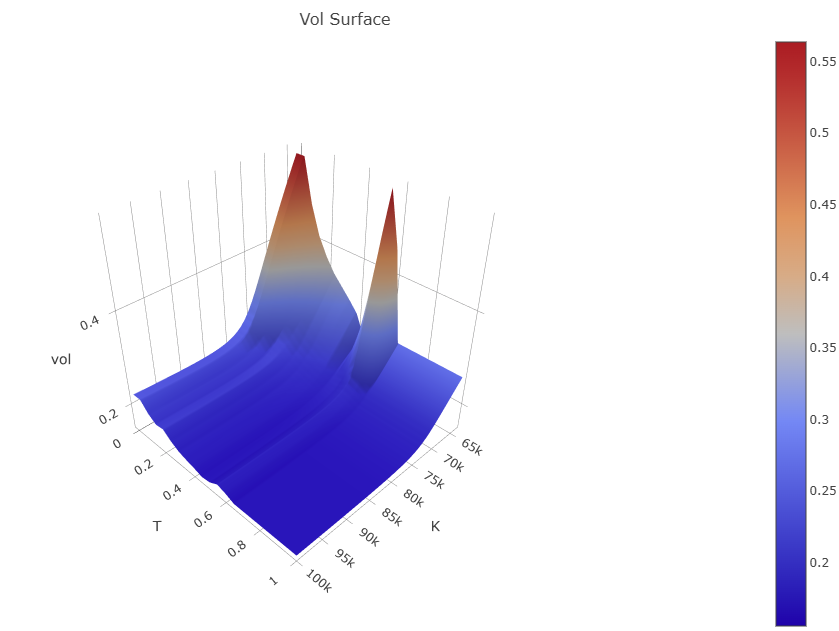
例2. 下例展示如何使用铜期货期权市场数据构建波动率曲面,并通过三维图表可视化波动率随到期时间和行权价的变化趋势:
// cu 铜期货期权波动率曲面构建示例

// 曲线构建的参考日期
referenceDate = 2025.12.02
// 期权到期日
optionExpiries = [2025.12.25, 2026.01.26, 2026.02.13, 2026.03.25, 2026.04.24, 2026.05.25, 2026.06.24, 2026.07.27]
// 标的期货合约到期日(与期权到期日一一对应)
futMaturities  = [2026.01.15, 2026.02.24, 2026.03.16, 2026.04.15, 2026.05.15, 2026.06.15, 2026.07.15, 2026.08.17]

// strikes: list of strike vectors (每个期权到期日对应一组 strikes)
strikes = [
    [64000, 65000, 66000, 67000, 68000, 69000, 70000, 71000, 72000, 73000, 74000, 75000, 76000, 77000, 78000, 79000, 80000, 82000, 84000, 86000, 88000, 90000, 92000, 94000, 96000, 98000, 100000],  //1
    [64000, 65000, 66000, 67000, 68000, 69000, 70000, 71000, 72000, 73000, 74000, 75000, 76000, 77000, 78000, 79000, 80000, 82000, 84000, 86000, 88000, 90000, 92000, 94000, 96000, 98000, 100000], //2
    [64000, 65000, 66000, 67000, 68000, 69000, 70000, 71000, 72000, 73000, 74000, 75000, 76000, 77000, 78000, 79000, 80000, 82000, 84000, 86000, 88000, 90000, 92000, 94000, 96000, 98000, 100000], //3
    [68000, 69000, 70000, 71000, 72000, 73000, 74000, 75000, 76000, 77000, 78000, 79000, 80000, 82000, 84000, 86000, 88000, 90000, 92000, 94000, 96000, 98000, 100000], //4
    [70000, 71000, 72000, 73000, 74000, 75000, 76000, 77000, 78000, 79000, 80000, 82000, 84000, 86000, 88000, 90000, 92000, 94000, 96000, 98000, 100000], //5
    [76000, 77000, 78000, 79000, 80000, 82000, 84000, 86000, 88000, 90000, 92000, 94000, 96000, 98000], //6
    [76000, 77000, 78000, 79000, 80000, 82000, 84000, 86000, 88000, 90000, 92000, 94000, 96000, 98000], //7
    [76000, 77000, 78000, 79000, 80000, 82000, 84000, 86000, 88000, 90000, 92000, 94000, 96000, 98000] //8
]

// optionPrices: 每个到期日对应的 option price 向量
optionPrices = [
    [25090, 24090, 23090, 22090, 21090, 20090, 19090, 18090, 17090, 16090, 15090, 14090, 13090, 12092, 11100, 10114, 9138 , 7240 , 5468 , 3898 , 2600 , 1608 , 914  , 482  , 232  , 102  , 40   ], // 1
    [25080, 24080, 23080, 22080, 21080, 20080, 19080, 18080, 17080, 16080, 15084, 14092, 13106, 12132, 11168, 10218, 9290 , 7520 , 5896 , 4462 , 3246 , 2266 , 1516 , 972  , 596  , 350  , 196  ], // 2
    [25030, 24030, 23030, 22030, 21030, 20030, 19030, 18030, 17034, 16044, 15058, 14082, 13116, 12164, 11230, 10316, 9426 , 7736 , 6196 , 4832 , 3660 , 2696 , 1930 , 1338 , 894  , 586  , 370   ], // 3
    [20970, 19970, 18970, 17972, 16980, 15996, 15018, 14052, 13100, 12162, 11244, 10348, 9478 , 7830 , 6336 , 5010 , 3864 , 2906 , 2136 , 1522 , 1066 , 722  , 480   ], // 4
    [18952, 17958, 16974, 15996, 15030, 14076, 13136, 12214, 11314, 10438, 9590 , 7986 , 6522 , 5228 , 4102 , 3150 , 2370 , 1742 , 1254 , 886  , 608   ], // 5
    [12830, 11924, 11040, 10182, 9350 , 7786 , 6372 , 5110 , 4030 , 3104 , 2354 , 1740 , 1270 , 904  ], // 6
    [13176, 12314, 11476, 10670, 9888 , 8416 , 7068 , 5874 , 4814 , 3890 , 3102 , 2450 , 1908 , 1468  ], // 7
    [12848, 11988, 11148, 10346, 9568 , 8102 , 6772 , 5590 , 4546 , 3644 , 2890 , 2260 , 1740 , 1320  ] // 8
]

// payoffTypes: 期权类型,用字符串 "Put"/"Call" 表示
payoffTypes = [
    take("Call", size(optionPrices[0])),
    take("Call", size(optionPrices[1])),
    take("Call", size(optionPrices[2])),
    take("Call", size(optionPrices[3])),
    take("Call", size(optionPrices[4])),
    take("Call", size(optionPrices[5])),
    take("Call", size(optionPrices[6])),
    take("Call", size(optionPrices[7]))
]

// 构建折现曲线
pillar_dates = [
    referenceDate + 2,
    referenceDate + 8,
    referenceDate + 93,
    referenceDate + 185,
    referenceDate + 276,
    referenceDate + 367,
    referenceDate + 732,
    referenceDate + 1099,
    referenceDate + 1463,
    referenceDate + 1828,
    referenceDate + 2558,
    referenceDate + 3654
]

pillar_values = [
    0.0145993931630537,
    0.0229075517972275,
    0.0253020667393029,
    0.0257564866303201,
    0.0259751440992468,
    0.0260355181479988,
    0.0265336263144786,
    0.0272721454114050,
    0.0282024453631075,
    0.0290231222075799,
    0.0304665029488732,
    0.0319855013976250
]

curve_dict = {
    "mktDataType": "Curve",
    "curveType": "IrYieldCurve",
    "referenceDate": referenceDate,
    "currency": "CNY",
    "dayCountConvention": "Actual365",
    "compounding": "Continuous",
    "interpMethod": "Linear",
    "extrapMethod": "Flat",
    "frequency": "",
    "dates": pillar_dates,
    "values": pillar_values,
    "name": "CNY_FR_007"
}

discountCurve = parseMktData(curve_dict)

print(discountCurve)

// 构建期货价格曲线
curve_dict = {
    "mktDataType": "Curve",
    "curveType": "AssetPriceCurve",
    "referenceDate": referenceDate,
    "dates":[2025.12.15, 2026.01.15, 2026.02.24, 2026.03.16, 2026.04.15, 2026.05.15, 2026.06.15, 2026.07.15, 2026.08.17, 2026.09.15, 2026.10.15, 2026.11.16],
    "values":[88770, 89090, 89080, 89030, 88970, 88950, 88590, 88660, 88350, 88120, 87910, 87840]
}
futPriceCurve = parseMktData(curve_dict)
print(futPriceCurve)

// 构建波动率曲面
surf = cmFutVolatilitySurfaceBuilder(referenceDate, futMaturities, optionExpiries, strikes, optionPrices, payoffTypes, discountCurve, futPriceCurve, formula='Black76', model='SVI', surfaceName='cu_future_option_vol_surface');

// 生成波动率预测数据用于可视化
dts = (0..20)*0.05
ks = (0..40)*((max(strikes[0])-min(strikes[0]))\40)+min(strikes[0])
m = optionVolPredict(surf, dts, ks).rename!(dts, ks)

// 绘制曲面图
plot(
    m,
    title=["Vol Surface", "K", "T", "vol"],
    chartType=SURFACE)
输出返回:
相关函数:parseMktData