Integrating Prometheus with the DolphinDB Rule Engine to Build an Agile Monitoring Solution
1. Overview
1.1 Background
As cloud-native, microservices, and containerized architectures become widely adopted in enterprise applications, system scale and complexity continue to grow. The scope of monitoring has expanded from basic infrastructure to application and business layers. Prometheus, the cloud-native ecosystem's standard for monitoring, excels at collecting, storing, and querying metrics. Many enterprises use it as the foundation of their monitoring infrastructure.
However, in practice, enterprises are finding that relying solely on the native Prometheus alerting system is insufficient for the monitoring and alerting requirements of complex business scenarios. The main challenges include:
-
The management cost of alerting rules continues to rise. Prometheus alerting rules are distributed in YAML files, and as business systems and the number of monitored metrics grow, the number of rule files increases rapidly. Modifying rules often requires manual investigation and operational overhead, which makes frequent adjustments difficult and hinders cross-team collaboration. Over time, this devolves into unmanageable "configuration debt".
-
Complex rules are difficult to handle. Prometheus supports combining multiple metrics via vector operations, but it fundamentally relies on set matching across time series. As metric sources and business complexity increase, data from multiple exporters (which convert the state of monitored systems into Prometheus metrics) is often not time-aligned. Metrics need to be aggregated and aligned (i.e., cleaning logic must be written in YAML files), which rapidly reduces rules readability and maintainability.
-
Furthermore, monitoring data holds significant analytical value. However, Prometheus lacks high-performance distributed storage and computing capabilities, making it difficult for enterprises to store and analyze large volumes of historical monitoring data over the long term.
1.2 Monitoring Solution Based on DolphinDB Rule Engine
This tutorial introduces a concise, efficient solution that deeply integrates Prometheus monitoring data with the DolphinDB rule engine to build an easy-to-operate, high-performance monitoring system. The core objectives are as follows:
-
Real-time monitoring and alerting in one: The rule engine performs real-time computation on monitoring metrics, and plugins enable rapid integration with existing enterprise alerting systems.
-
Lightweight architecture with high performance: The rule engine can process up to millions of rule evaluations per second, effectively meeting the monitoring demands of large-scale instances. No additional middleware is introduced, reducing monitoring system complexity and resource consumption.
-
Long-term data storage and deep analysis: Monitoring data and alerting data can be stored in DolphinDB distributed databases, supporting long-term trend analysis, capacity planning, and operational retrospective analysis.
-
Easy operational management: Rules are managed centrally in DolphinDB and written in DLang. Monitoring rules support hot update, which greatly improves the efficiency of management.
In summary, users can implement an end-to-end monitoring solution in DolphinDB—ranging from real-time alerting to long-term data analysis—thereby further enhancing system observability and operational efficiency.
2. Prometheus Monitoring Metric Synchronization
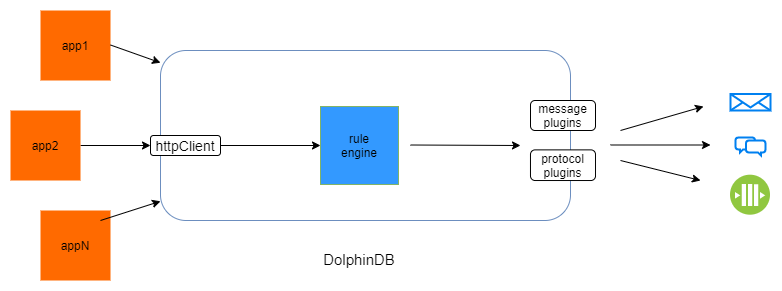
The HttpClient Plugin supports calling the Prometheus HTTP API to retrieve monitoring metrics in real time. For detailed usage of the HttpClient Plugin, please refer to the plugin documentation: HttpClient . After a simple data format conversion, monitoring metric data can be written directly to DolphinDB distributed tables or stream tables.
2.1 Introduction to the Prometheus HTTP API
Prometheus provides a stable HTTP API for querying and manipulating time-series data, with all responses returned in JSON format. The following introduction is about the core functionality of this API. For detailed information, please refer to: Prometheus . The relevant APIs are briefly described below to facilitate the use of the HttpClient Plugin for data synchronization.
2.1.1 HTTP API Basics
Base path: /api/v1
Status codes:
-
Returns
2xxwhen a request is executed successfully. -
Returns
400 Bad Requestwhen parameters are missing or incorrect. -
Returns
422 Unprocessable Entitywhen an expression cannot be executed. -
Returns
503 Service Unavailablewhen a query times out or is aborted.
Response format: JSON. The response envelope format is as follows:
{
  "status": "success" | "error",
  "data": <data>,
  // Only set if status is "error". The data field may still hold
  // additional data.
  "errorType": "<string>",
  "error": "<string>",
  // Only set if there were warnings while executing the request.
  // There will still be data in the data field.
  "warnings": ["<string>"],
  // Only set if there were info-level annotations while executing the request.
  "infos": ["<string>"]
}
2.1.2 Instant Query
The following endpoint evaluates an expression at a single point in time.
GET /api/v1/query
POST /api/v1/query
URL query parameters:
-
query=<string>: Prometheus expression query string. -
time=<rfc3339 | unix_timestamp>: Optional. Evaluation timestamp. If omitted, the current server time is used. -
timeout=<duration>: Optional. Evaluation timeout. -
limit=<number>: Optional. Maximum number of series to return.
Time Parameter Handling
Prometheus stores all time-series data in UTC time , while most client execution environments use local time as their timezone, so a time conversion is required when constructing query requests. The specific conversion method depends on the client tool you are using:
-
curl command: You need to manually convert local time to UTC time at the command line. For example, convert local time "2025-11-10 16:14:27" to UTC time "2025-11-10T08:14:27Z" before passing it in.
-
DolphinDB HTTP Client: DolphinDB uses local time (e.g., UTC+8) by default for data processing and queries. When querying a metric at a specific point in time, you can use the built-in time function
gmtimeto convert to UTC before passing it in. When retrieving data from Prometheus for alerting rules processing, you also need to convert it to local time using functionlocaltime.
Example: Query the metric
lastMinuteNetworkRecv
at time
2025-11-10T08:14:27Z
(UTC).
curl 'localhost:9090/api/v1/query?query=lastMinuteNetworkRecv&time=2025-11-10T08:14:27Z'Result:
text: '{
  "status":"success",
  "data":{
    "resultType":"vector",
    "result":[
      {
        "metric":{
          "__name__":"lastMinuteNetworkRecv",
          "instance":"host:port",
          "job":"DolphinDB"
        },
        "value":[1762762467,"1952900"]
      }
    ]
  }
}'
elapsed: 0.001651
headers: 'HTTP/1.1 200 OK Content-Type: application/json Vary: Origin Date: Mon, 10 Nov 2025 08:51:03 GMT Content-Length: 193 '
responseCode: 200
2.1.3 Range Query
Users can query a time range of data through the query_range endpoint. A single query for one time series can return a maximum of 11,000 data points.
GET /api/v1/query_range
POST /api/v1/query_range
URL query parameters:
-
The
query,limit, andtimeoutparameters are the same as those for Instant Query and are not repeated here. -
start=<rfc3339 | unix_timestamp>: Start timestamp, inclusive. -
end=<rfc3339 | unix_timestamp>: End timestamp, inclusive. -
step=<duration | float>: Query resolution step, indurationformat or as a float number of seconds.
Example: Query the metric
lastMinuteNetworkRecv
over the time range 2025-11-10T08:14:00 to 2025-11-10T08:15:00 with a step of 15s.
curl 'localhost:9090/api/v1/query_range?query=lastMinuteNetworkRecv&start=2025-11-10T08:14:00Z&end=2025-11-10T08:15:00Z&step=15s'Return:
text: '{
  "status":"success",
  "data":{
    "resultType":"matrix",
    "result":[
      {
        "metric":{
          "__name__":"lastMinuteNetworkRecv",
          "instance":"host:ip",
          "job":"DolphinDB"
        },
        "values":[
          [1762762440,"1985379"],
          [1762762455,"1952832"],
          [1762762470,"1952900"]
        ]
      }
    ]
  }
}'
elapsed: 0.001218
headers: 'HTTP/1.1 200 OK Content-Type: application/json Vary: Origin Date: Mon, 10 Nov 2025 09:03:54 GMT Content-Length: 242 '
responseCode: 200
2.2 Prometheus Data Synchronization Example
If no monitoring data is currently available locally, you can refer to Monitoring with Prometheus to monitor a DolphinDB instance and generate sample data.
Importing Historical Data
First, create a table to store monitoring data using TSDB engine, partitioned by month (for larger datasets, it can be partitioned by day), with the monitoring metric as the sortKey. For the complete code, please refer to the attached file metricData.dos.
//drop database if exists "dfs://metricDB"
create database "dfs://metricsDB"
partitioned by VALUE(2025.10M..2025.11M)
engine="TSDB"
create table "dfs://metricsDB"."data"(
    metric_name SYMBOL[comment="monitoring metrics"],
    timestamp TIMESTAMP[comment="monitoring timestamp",compress="delta"],
    value DOUBLE[comment="monitored value"],
    instance SYMBOL[comment="monitored instance"],
    job SYMBOL[comment="name of Promethus job"]
)
partitioned by timestamp
sortColumns = `metric_name`timestamp
The following example fetches 1 day of historical data:
// Load the plugin; only needs to be loaded once per server startup
loadPlugin("httpClient");
// url: conforms to Prometheus query specification
// Query all data for the lastMinuteNetworkRecv metric over the past 1 day; Prometheus default scrape interval is 15s, so step=15s
//1. Send request
url = 'localhost:9090/api/v1/query_range?query=lastMinuteNetworkRecv&start=2025-11-09T08:15:00Z&end=2025-11-10T08:15:00Z&step=15s'
res = httpClient::httpGet(url)
The request returns a dictionary containing the keys responseCode, header, elapsed, text. A sample return value for this example is shown below:
text: '{"status":"success","data":{"resultType":"matrix","result":[{"metric":{"__name__":"cpuUsage","instance":"host:port","job":"DolphinDB"},"values":[[1764576480,"0"],[1764576495,"0"],[1764576510,"0"]]}]}}'
elapsed: 0.0021
headers: 'HTTP/1.1 200 OK Content-Type: application/json Vary: Origin Date: Fri, 05 Dec 2025 04:33:34 GMT Content-Length: 211 '
responseCode: 200
The returned data is of the STRING type corresponding to the
text
key, whose content is organized in JSON format. The returned STRING value needs to be executed and parsed as metacode to facilitate data transformation and storage. In addition, Prometheus returns timestamps as integers by default, where the epoch starts at 1970.01.01 and the unit is seconds. Here the
temporalAdd
function is used to convert them to the DolphinDB TIMESTAMP type.
//2. Build parsing template
str = '{
  "metric":{
    "__name__":"lastMinuteNetworkRecv",
    "instance":"host:9001",
    "job":"DolphinDB"
    },
  "values":[[1,2]]
}'
d3 = parseExpr(str).eval()
d2=dict(STRING, ANY)
d2["resultType"]="matrix"
d2["result"]=[d3]
d1=dict(STRING, ANY)
d1["status"]="success"
d1["data"]=d2
res2 = parseExpr(res.text, d1).eval()
//3. Parse and assemble data
res3 = res2.data.result[0]
res4=res3.values.transpose()
metricDict=res3.metric
ts =  temporalAdd(timestamp(1970.01.01), res4[0], "s")
val = res4[1].double()
n = val.size()
data = table(take(metricDict["__name__"], n) as metricName,
    localtime(ts) as timestamp,
    val as value,
    take(metricDict["instance"], n) as instance,
    take(metricDict["job"], n) as job
)
//4. Write to Distributed Table
pt = loadTable("dfs://metricsDB","data")
tableInsert(loadTable("dfs://metricsDB", "data"), data)
3. Integrating the DolphinDB Rule Engine with Prometheus
3.1 Database Resource Monitoring Solution
This example implements real-time monitoring of hardware resources such as DolphinDB server CPU usage, memory usage, disk space, and network traffic. Prometheus automatically collects key metrics such as
cpuUsage
,
memoryUsed
, and
diskFreeSpaceRatio
, while the DolphinDB rule engine is used to configure threshold alerts so that resource bottlenecks can be detected and warned about in time, ensuring stable database service.
Alerting rule examples:
cpuUsage > 90
diskFreeSpaceRatio < 0.1
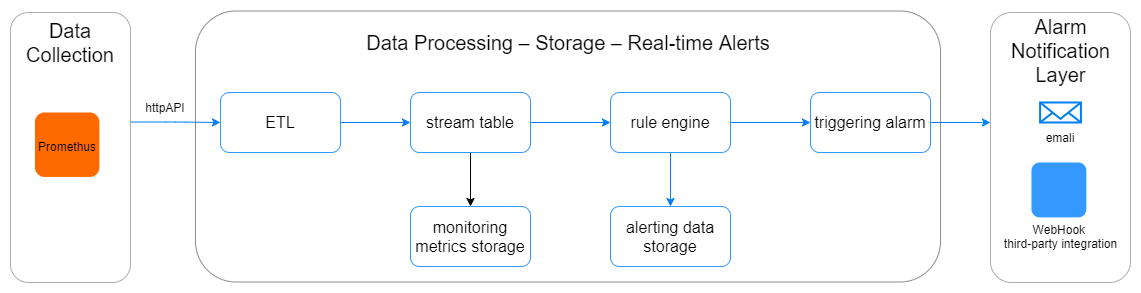
networkRecvRate > 10000000The overall architecture adopts dual-layer storage with a stream table and a distributed table, used respectively for real-time data processing and historical data storage. The stream table acts as both the input and the input buffer layer of the rule engine. This design improves system concurrency and also enhances the scalability of the data consumption layer.
3.2 Implementation
The implementation mainly consists of three parts: Prometheus monitoring data ingestion and ETL, rule engine creation and alert output, and hot update of monitoring rules.
3.2.1 Ingesting Monitoring Data into a DolphinDB Stream Table
// Define the table schema.
colName = `metricName`timestamp`value`instance`job;
colType = [SYMBOL, DATETIME, DOUBLE, STRING, STRING];
// Create and persist the dataReceiveTable Stream Table to receive real-time fetched data.
enableTableShareAndPersistence(
    table=streamTable(1000:0, colName, colType),
    tableName=`dataReceiveTable,
    cacheSize=1000000
);
// Create a DFS table to store data processed by the Rule Engine.
create table "dfs://metricsDB"."warn"(
    metric_name SYMBOL,
    timestamp TIMESTAMP,
    value DOUBLE,
    instance SYMBOL,
    job SYMBOL,
    rule BOOL[]
)
partitioned by timestamp
sortColumns = `metric_name`timestamp
Here, server hardware resource data is obtained by scheduled polling. Two functions are defined for this purpose:
query
and
pullData
. The polling approach minimizes intrusiveness to the monitored target as much as possible, which better matches the requirement for lightweight monitoring.
-
query: Sends an instant query request and parses the HTTP response into table data.
-
pullData: Calls
queryto poll the Prometheus server periodically and obtain data.
The parameter metrics is a string vector containing the names of the hardware resource metrics to be queried, and interva l is the polling interval in seconds. It is recommended to keep it consistent with the scrape_interval setting in the Prometheus configuration file.
loadPlugin("httpClient");
def dict2Table(dataDict){
    v = dataDict.value
    metricDict=dataDict.metric
    ts =  timestamp(long(v[0]*1000))
    val = v[1].double()
    return table(
        take(metricDict["__name__"], 1) as metricName,
        localtime(ts) as timestamp,
        val as value,
        take(metricDict["instance"], 1) as instance,
        take(metricDict["job"], 1) as job
    )
}
def query(host, port, metrics){
    url = host + ":" +  port + '/api/v1/query'
    params = {
        query: metrics
    }
    res = httpClient::httpGet(url, params)
    rst = parseExpr(res.text).eval()
    allMetrics = select instance, timestamp, metricName, value, job
        from each(dict2Table, rst.data.result).unionAll()
        order by instance, metricName
    return allMetrics
}
// Define the real-time data pulling function. The interval can match the Prometheus scrape interval.
def pullData(host, port, metrics, table, interval=15){
    do{
        data = query(host, port, metrics)
        tableInsert(table, data)
        sleep(interval*1000)
    }while(true)
}
// Replace the following values based on your monitoring requirements.
host = "192.198.1.36"
port = 9090
metrics = '{__name__=~"cpuUsage|diskFreeSpaceRatio|networkRecvRate"}'
targetTable = objByName("metricsStream")
jobId = stringFormat("pullPromethus_%W_%i", host, port).strReplace(".", "_")
submitJob(jobId, "get Promethus metrics", pullData, host, port, metrics, targetTable)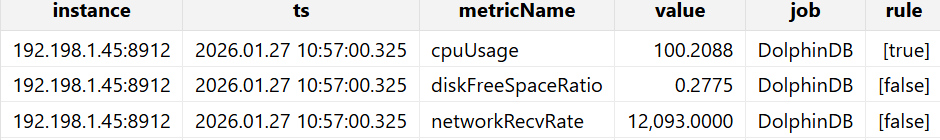
3.2.2 Monitoring and Alerting with the DolphinDB Rule Engine
The DolphinDB Rule Engine is a concise, efficient, and extensible module for rule checking and alerting. It supports centralized O&M of monitoring rules, including adding, modifying, and deleting rules, which can greatly improve operational efficiency.
The DolphinDB Rule Engine marks inserted data according to user-defined rule sets, outputs the marked data to a specified table, and invokes a callback function so that users can process marked data according to custom logic. For details, refer to creatRuleEngine .
In this example,
ruleSets
is initialized as follows:
// Initialize ruleSets.
index = array(SYMBOL, 0)
index.append!(`cpuUsage`diskFreeSpaceRatio`networkRecvRate NULL)
rule = [[<value > 90>], [<value < 0.1>], [<value > 10000000>], [<value == NULL >]];
ruleSets = dict(index, rule);
The callback function can be used to implement data cleansing, data writing, alerting, and other logic. In this example, one alert delivery method is provided: email alerts. Users can integrate their existing enterprise alerting system with DolphinDB message/protocol plugins based on actual application scenarios.
Use the DolphinDB httpClient plugin to send alert emails.
def send2Email(result){
    if(result.rule[0]){
        text = stringFormat("Server %W service/resource %W %W alert. Current value: %.2f",
            result.instance[0], result.job[0], result.metricName[0], result.value[0])
        res = httpClient::sendEmail('MailFrom@xxx.com','password','MailDestination@xxx.com','Data Alert', text);
    }
}
Finally, consume data by subscribing to the stream table with the
subscribeTable
function.
// Create the Rule Engine.
colName = `metricName`timestamp`value`instance`job;
colType = [SYMBOL, DATETIME, DOUBLE, STRING, STRING];
dummy = table(1:0, colName, colType)
ruleEngine = createRuleEngine(
        name="ruleEngine",
        ruleSets=ruleSets,
        dummyTable=dummy,
        outputColumns=`metricName`timestamp`value`instance`job,
        outputTable=loadTable("dfs://metricsDB", "warn"),
        policy="all",
        ruleSetColumn="metricName",
        callback=send2Wechat
)
subscribeTable(
    tableName="dataReceiveTable",
    actionName="write2ruleEngine",
    handler=getStreamEngine("ruleEngine"),
    msgAsTable=true,
    batchSize=10000,
    throttle=3
)
Note: This tutorial assumes that alert events occur at a per-second frequency, which is suitable for most application scenarios. If the actual alert density is very high, for example, thousands of alerts per second, it is not recommended to call I/O-related functions directly in the callback because the callback is executed synchronously. In this case, you can write alert results to a stream table through outputTable , then subscribe to that stream table and implement the alert delivery logic in the handler.
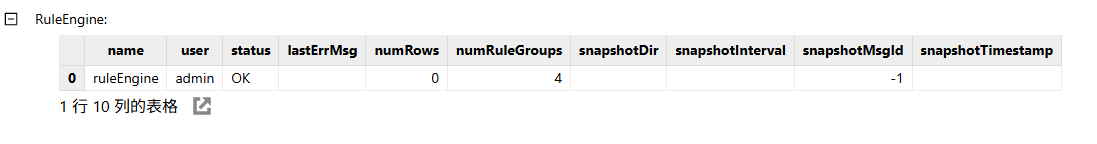
After initializing the engine, run
getStreamEngineStat()
to view the engine state.
The engine output (
outputTable
) contains the original monitoring information as well as the rule evaluation result
rule
.
rule
is a boolean array. You can filter data that exceeds the threshold with
rule[0] = true
.
select * from loadTable("dfs://metricsDB", "warn")
where rule[0] = true
order by timestamp desc limit 100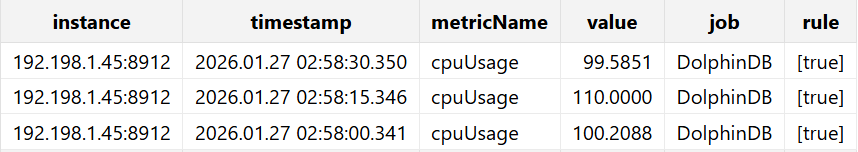
3.2.3 Hot Update of Rule Sets
As monitoring conditions change, for example, due to scaling hardware resources for containers or changes in business load, monitoring thresholds often need to be adjusted dynamically. The DolphinDB rule engine supports online dynamic rule adjustment. Rules can be added, modified, or deleted at runtime through the
updateRule
and
deleteRule
functions.
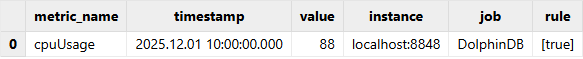
Example of updating a monitoring rule
Call
updateRule
to update the CPU threshold online to 85 percent.
updateRule("ruleEngine","cpuUsage",[<value>85>])After the update, insert a new record with a new timestamp.
ruleEngine.append!(table("cpuUsage" as metric_name, datetime(2025.12.01 10:00:00) as timestamp, 88.0 as value, "localhost:8848" as instance, "DolphinDB" as job))
getRules(["ruleEngine"])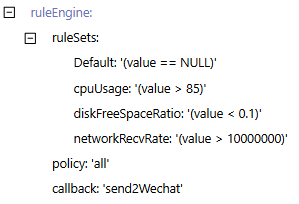
After the modification, the rule engine successfully outputs the new alert information.
4. Conclusion
By integrating Prometheus with DolphinDB and leveraging the rule engine's efficient real-time computation and hot update capabilities, this tutorial implements centralized monitoring and alerting with a simple architecture and convenient O&M. It effectively solves problems in traditional solutions such as scattered and hard-to-manage rules, the high cost of adjusting online rules, and the disconnect between monitoring and long-term storage. The solution supports stable operation and continuous evolution of enterprise applications.